NOTE: This post was dual published to the mabl blog here

Unit tests run in the context of your source code. If a Unit test fails, the output points you directly to the lines of code you need to explore. End-to-end tests, using low-code tools like mabl, run in the context of the whole system. You’re not inside your IDE anymore, in fact the test runs may be triggered based on time or CI/CD. You may not be in front of a computer at all! So, how can we bridge the gap from the test-run back to the source code, like a unit test?
Observability tools, like Honeycomb, take OpenTelemetry produced by your code and provide a way to query this in the context of the whole system. We can easily find raised exceptions, slow functions, method calls correlated by a user_id, transactions over a database, you name it! You’re limited only by how well your system is instrumented.
So, to bridge the test-run-to-code gap, this post shows how to make mabl tests observable in Honeycomb.
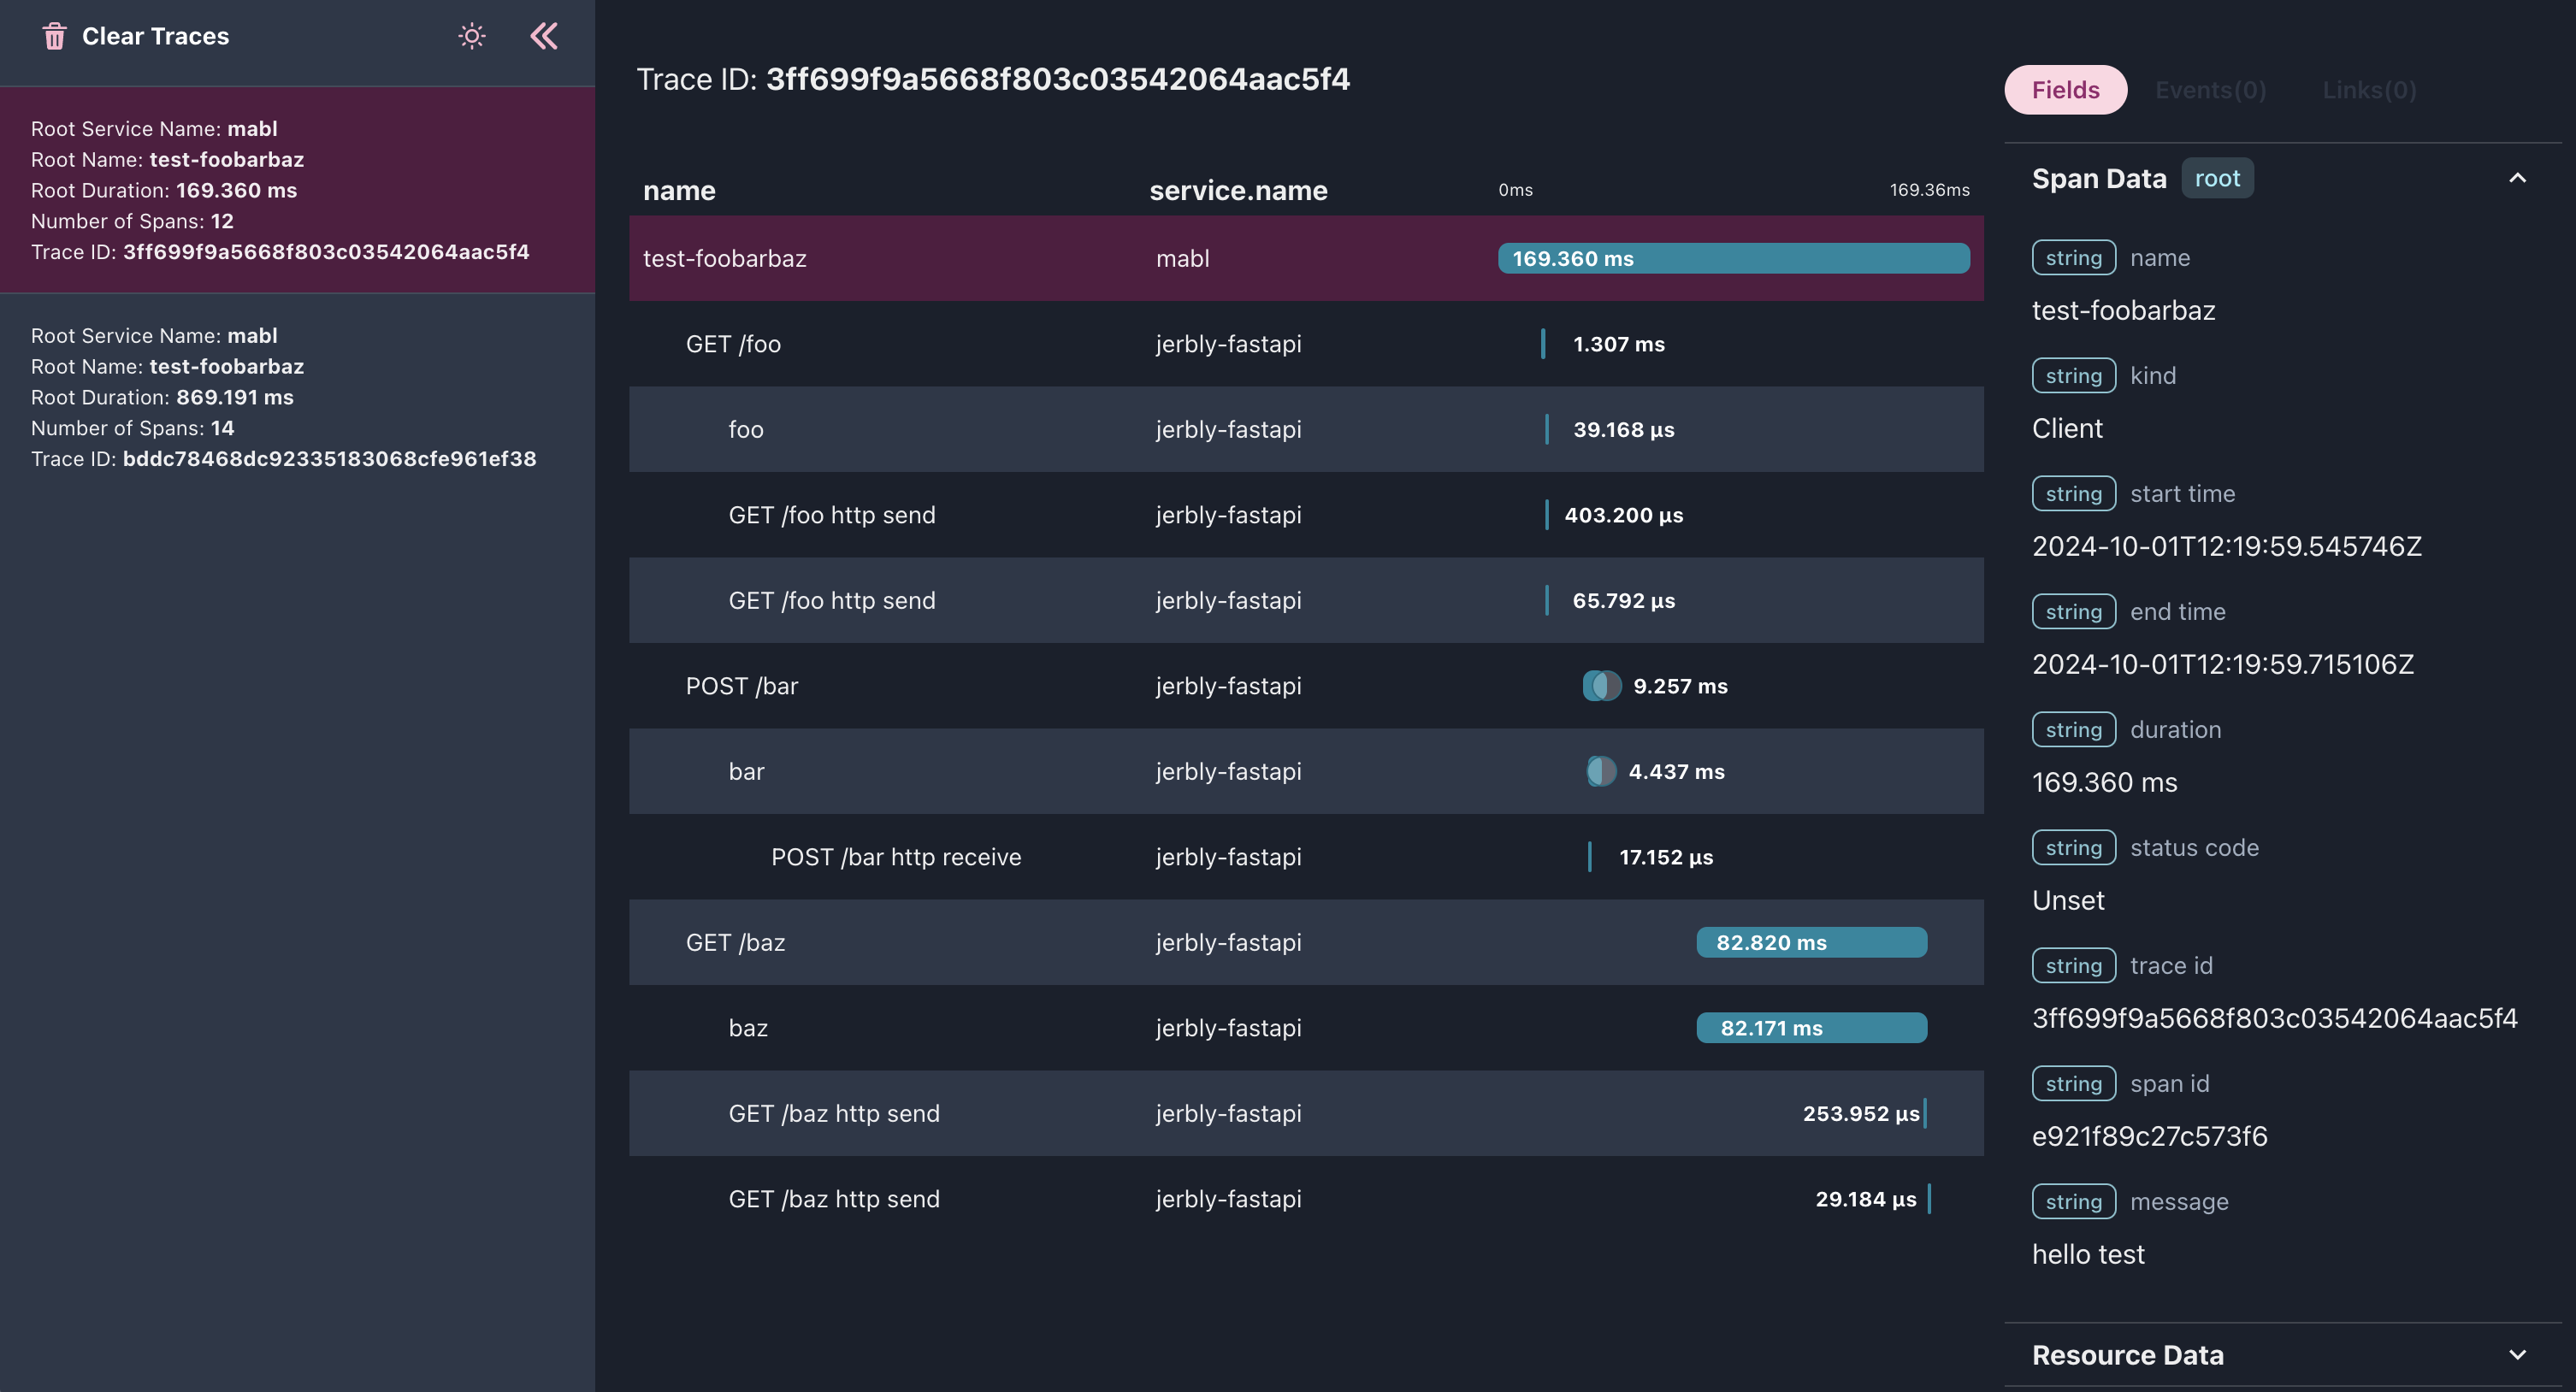
Note that Honeycomb is the excellent Observability tool used in this post, however this is all based on the OpenTelemetry standard so other tools can be used too. For example here’s a sneak peak of our API Test in otel-desktop-viewer:
Quick intro to tracing
If you’re familiar with logging but not tracing, this blog post is a simple introduction: Observability Is About Confidence.
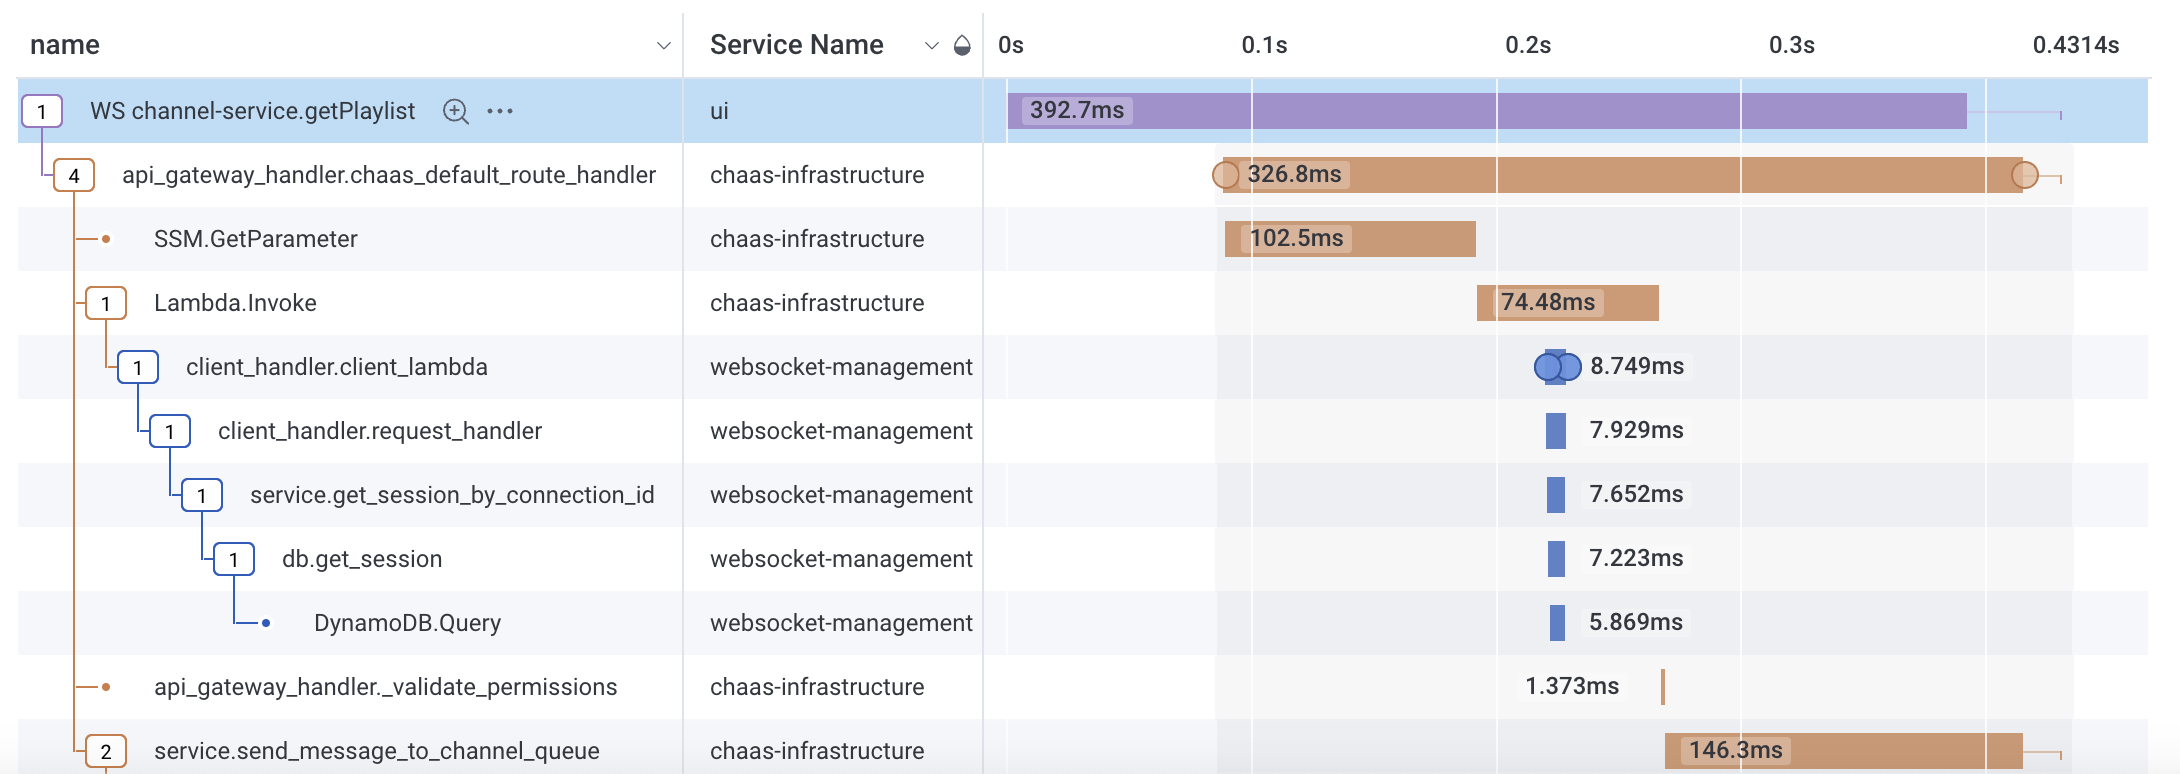
The trace above, taken from evertz.io, shows the call flow through part of the stack. Each row in the chart is a span with a name, service.name and many other fields provided by your instrumented code. Honeycomb ingests these spans to a powerful database to provide insight into system behaviour, debugging, alerting on trends, service level objectives and a whole lot more.
Notice how Service Name starts at the top with ui, this is tracing coming from the user’s browser. In this case the browser has made a call through a websocket to the backend service chaas-infrastructure - this service then makes a lambda call to websocket-management and so on. This service-to-service tracing is known as Distributed Tracing which we’ll get into later in this post.
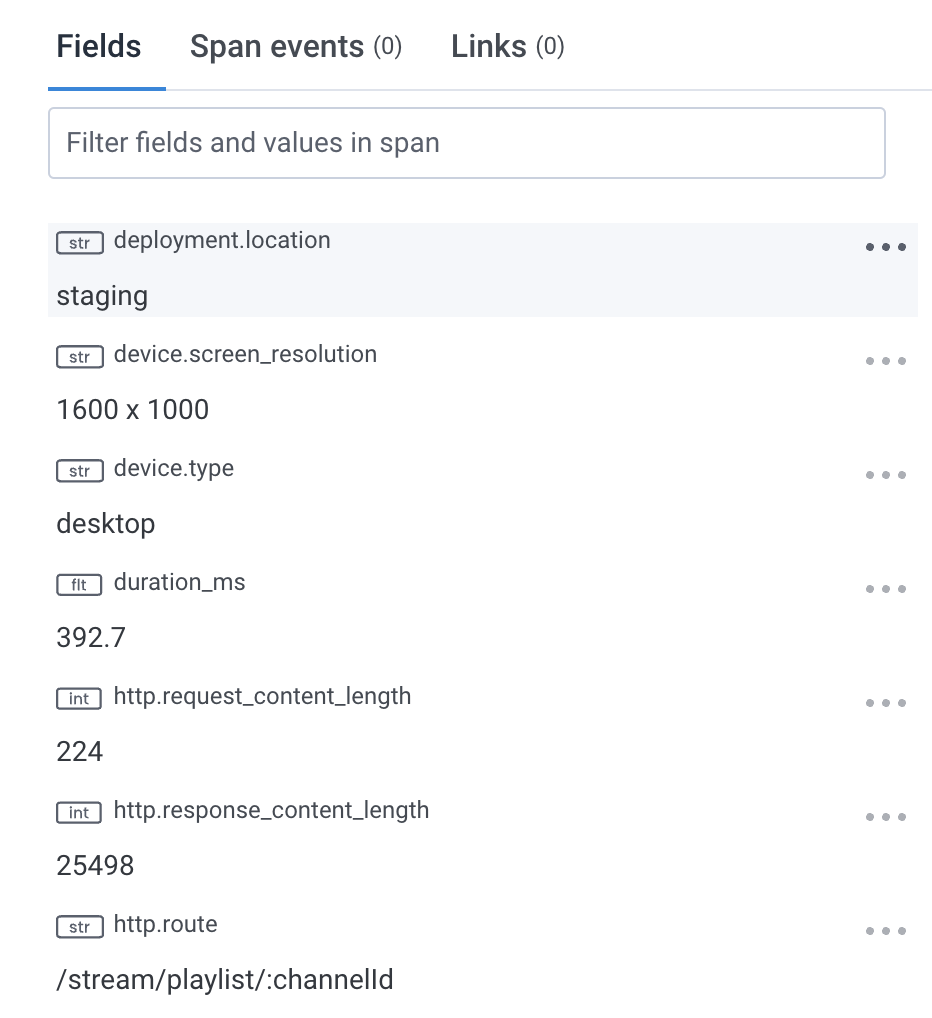
Each span can have hundreds of fields (a.k.a. span attributes), the snapshot above is a small section from the ui span. Since this span came from the browser, it includes information like device.type. Every field across all your services is queryable in Honeycomb allowing you to slice and dice your data in a SQL-like language.
Linking system traces with test-runs
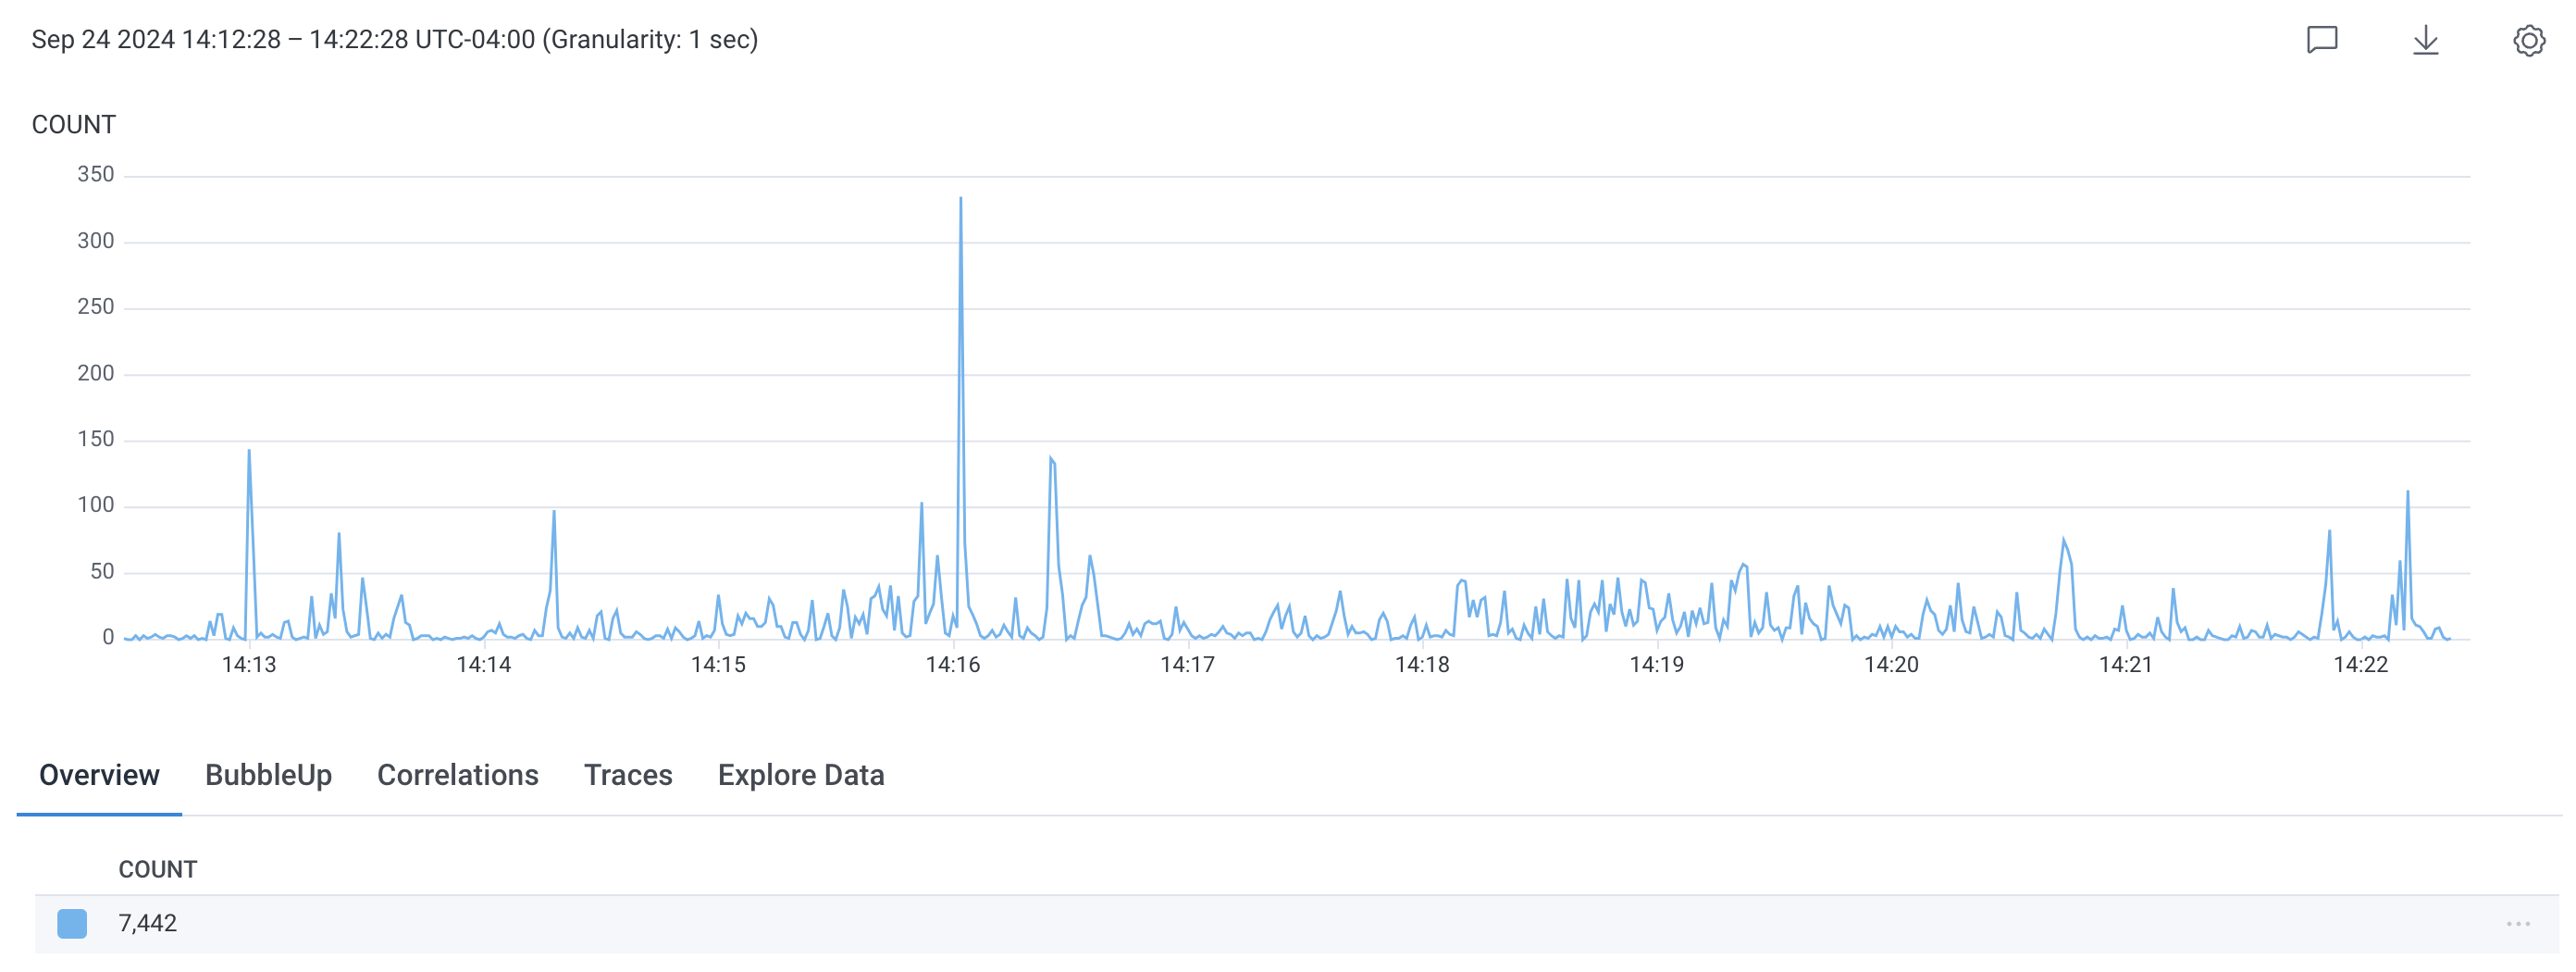
All this rich data in tracing is amazing! The problem now becomes how to find what you’re looking for. Below is a query over 10 minutes, just from the UI dataset in our Dev environment: 7442 spans!
We want to correlate traces with test-runs. Two key pieces of information that can help are the name of the test and the id of the test-run. For our app we added the ability to inject these values in the querystring: https://my-app.com/?testName=my_test_name&testRunId=12345 and emit them in the telemetry as: test.name and test.run_id. Now with a quick filter, the traces we want to look at pop out! 119 versus 7442!
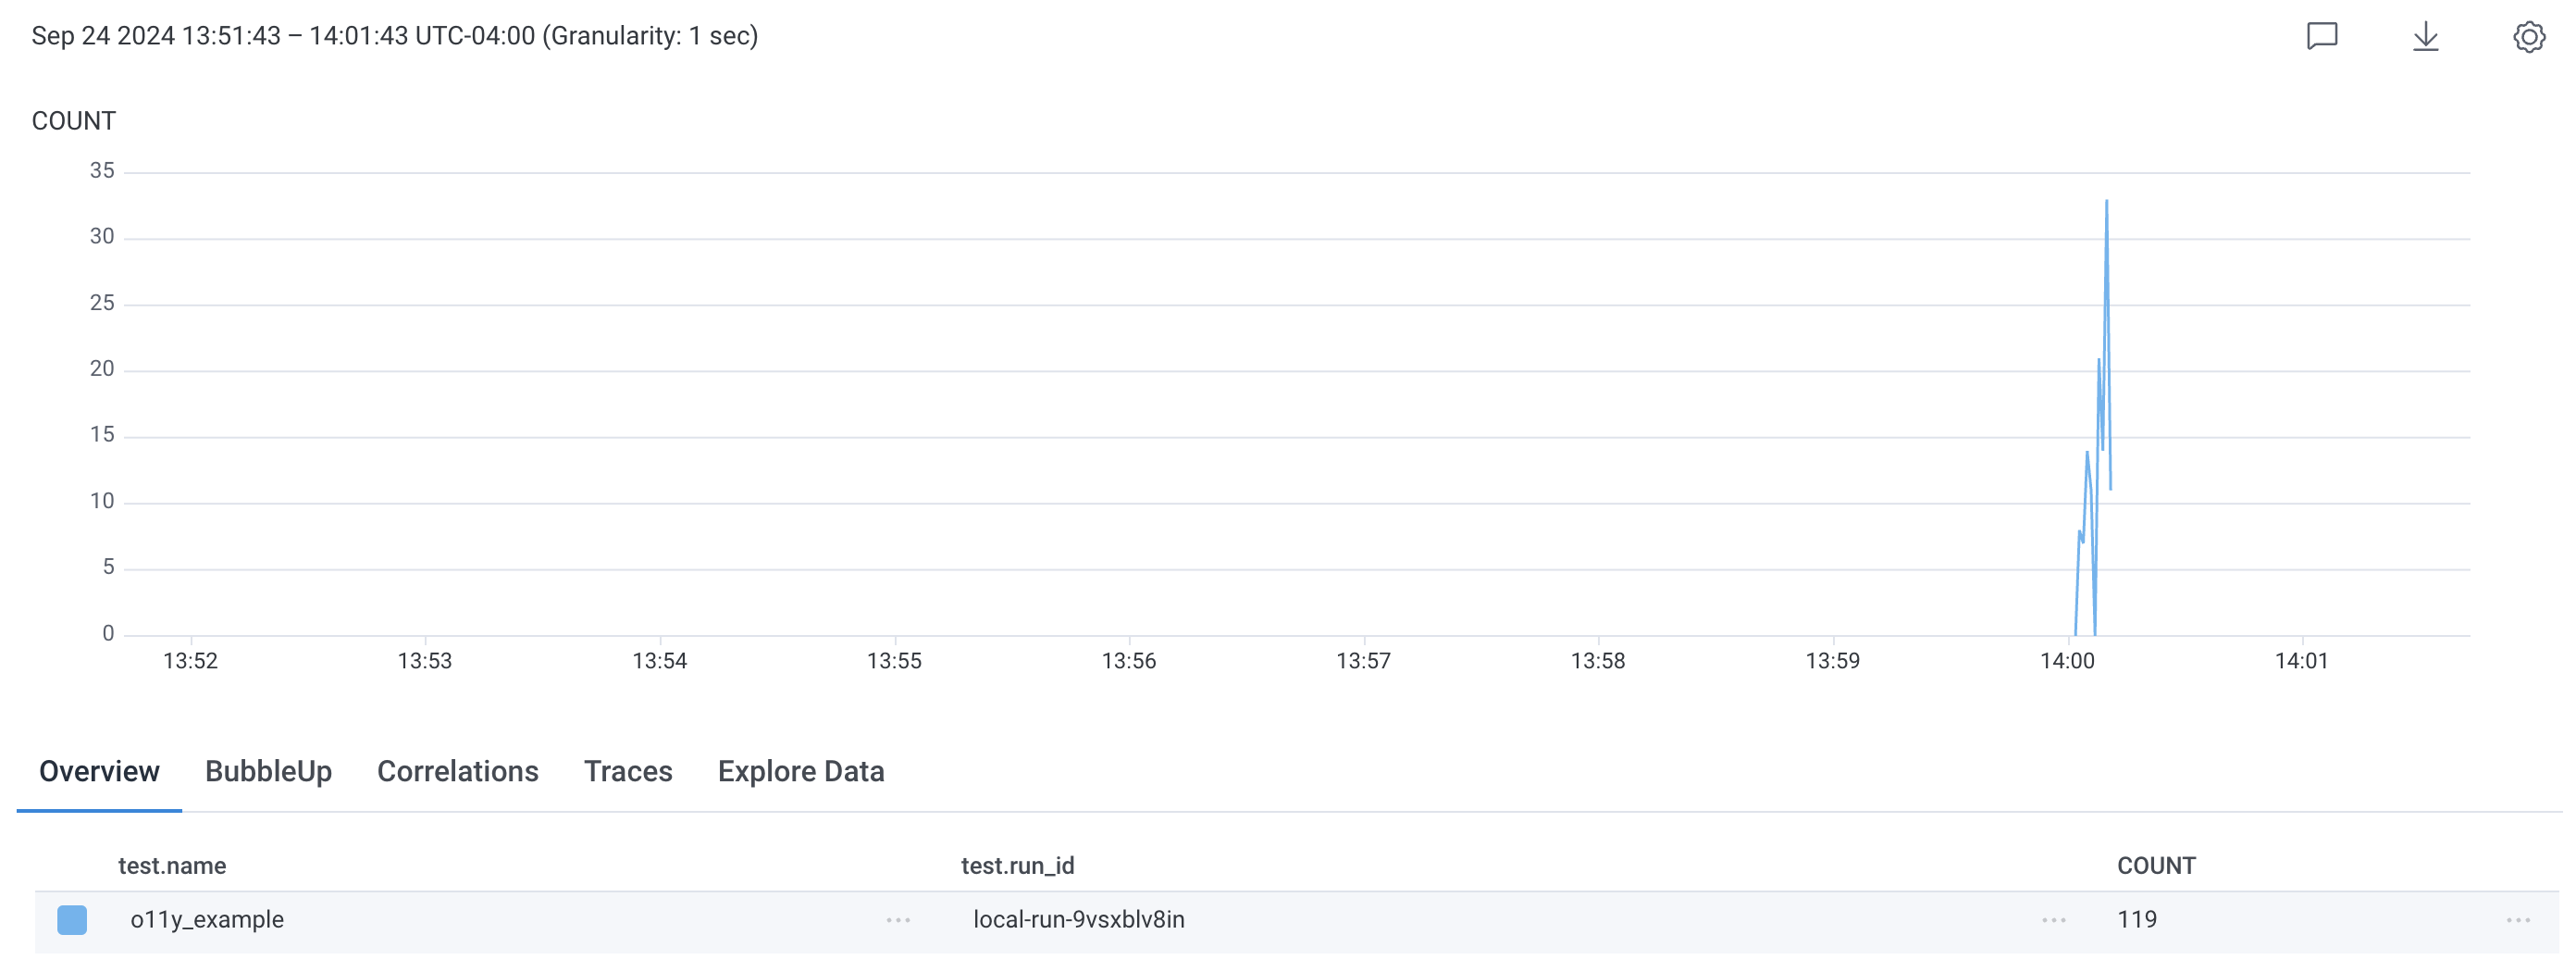
With test.name we can find all runs of that test. With test.run_id we can find an individual test-run. From the opposite perspective, if you’re exploring in Honeycomb you may find an interesting trace and on inspection you can see that it came from a particular mabl test.
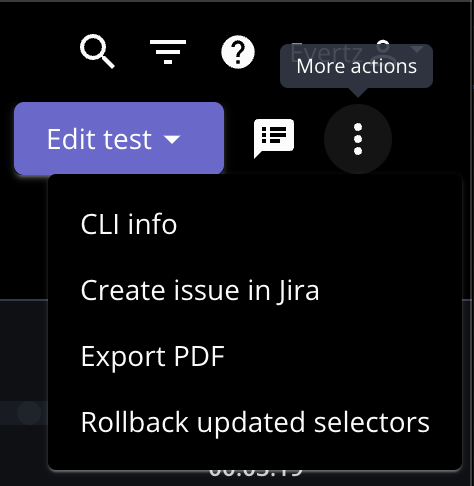
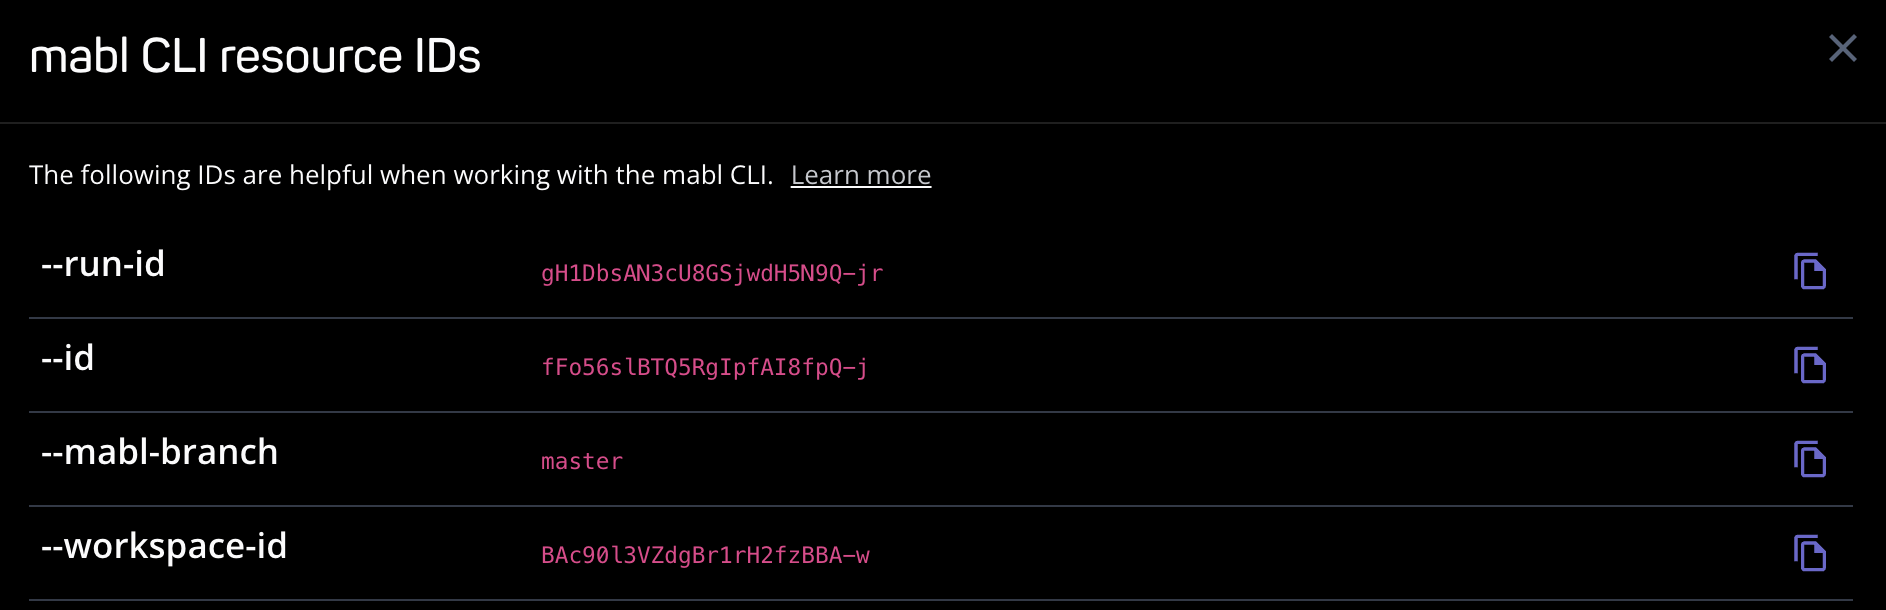
In mabl we can use a Visit Url step to go to a page with the querystring containing our variables. The test run-id is available in a Runtime Variable: app.test_run_id. So you could write the url as: {{@app.url}}/?testName=my_test_name&testRunId={{@app.test_run_id}}. This works great for cloud runs. You can find the run id here:
The problem with app.test_run_id is for a local run this is always set to local-run which doesn’t help differentiate between runs when you’re debugging. To fix this we can use a simple JavaScript snippet to create a random string when running locally:
function mablJavaScriptStep(mablInputs, callback, id = '{{@app.test_run_id}}') {
  let result;
  if (id === 'local-run') {
    result = id + "-" + Math.random().toString(36).substring(2, 18);
  } else {
    result = id;
  }
  callback(result);
}
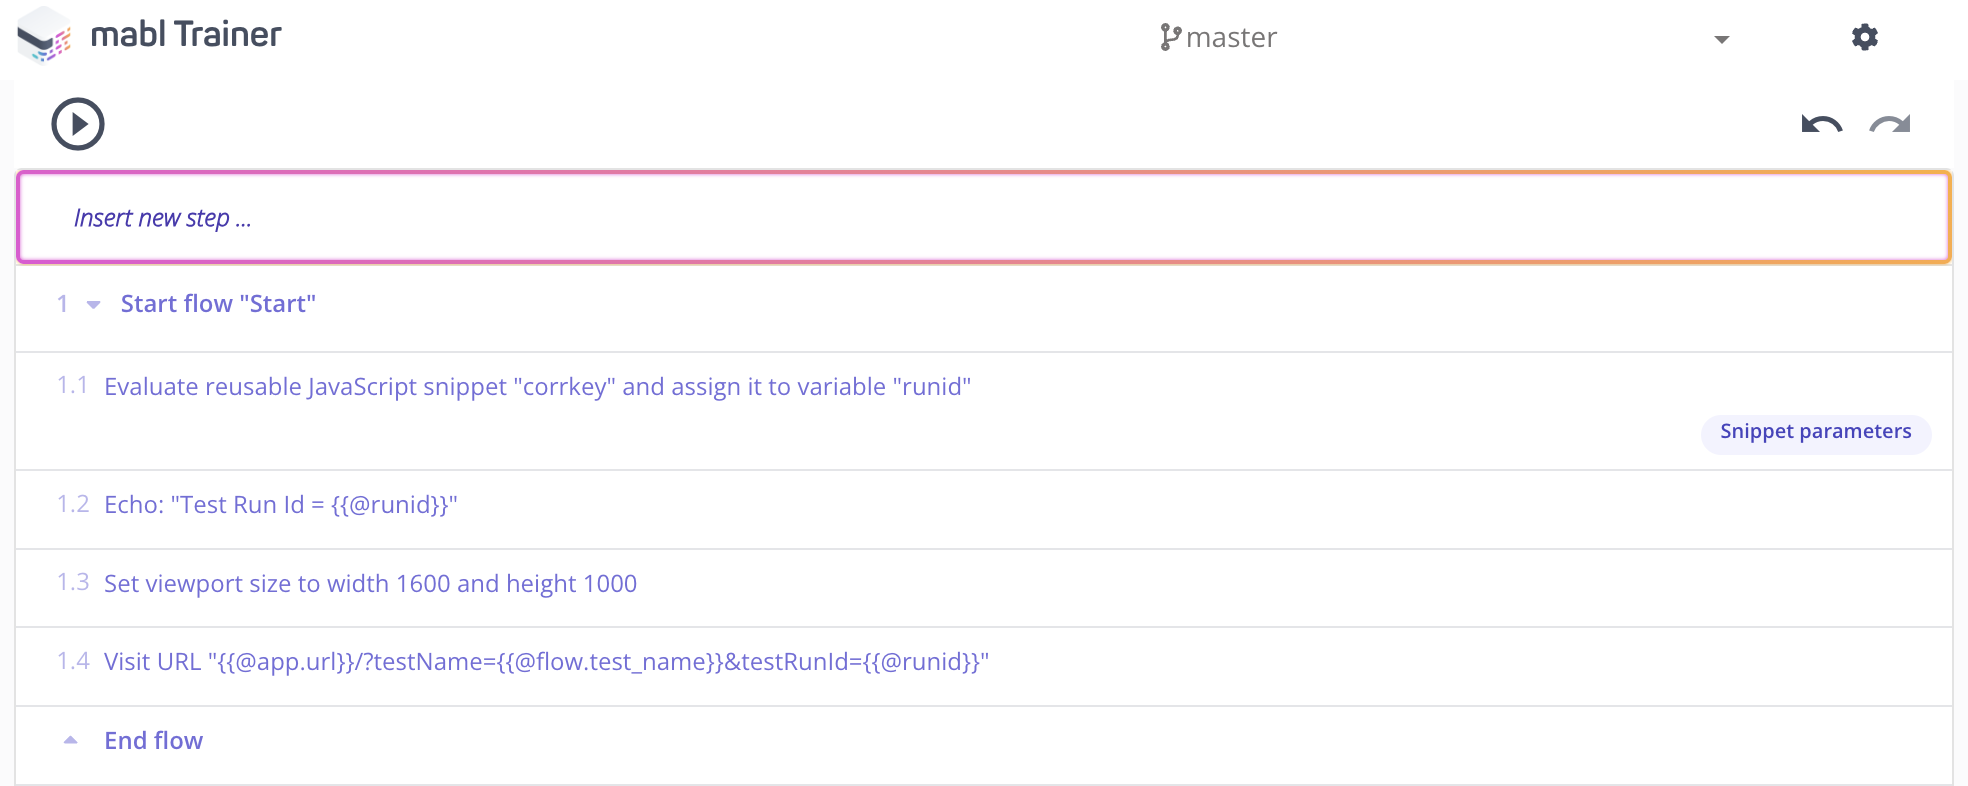
Follow this with an Echo Step so the run-id is easy to find.
To finish this off neatly you can put all this logic into a flow making it really easy to reuse. The flow needs a single parameter for test.name making the final url: {{@app.url}}/?testName={{@flow.test_name}}&testRunId={{@runid}} where runid is the output of the JavaScript snippet.
Here’s an example trace from a failing test-run. We were able to take the test-run-id from the cloud-run: WcCb9KyJO8jXBmTzEybqGQ-jr and plug it into a query in Honeycomb. Then hone in on this small set of traces to land on a user click activity that led to an exception in a back-end microservice.
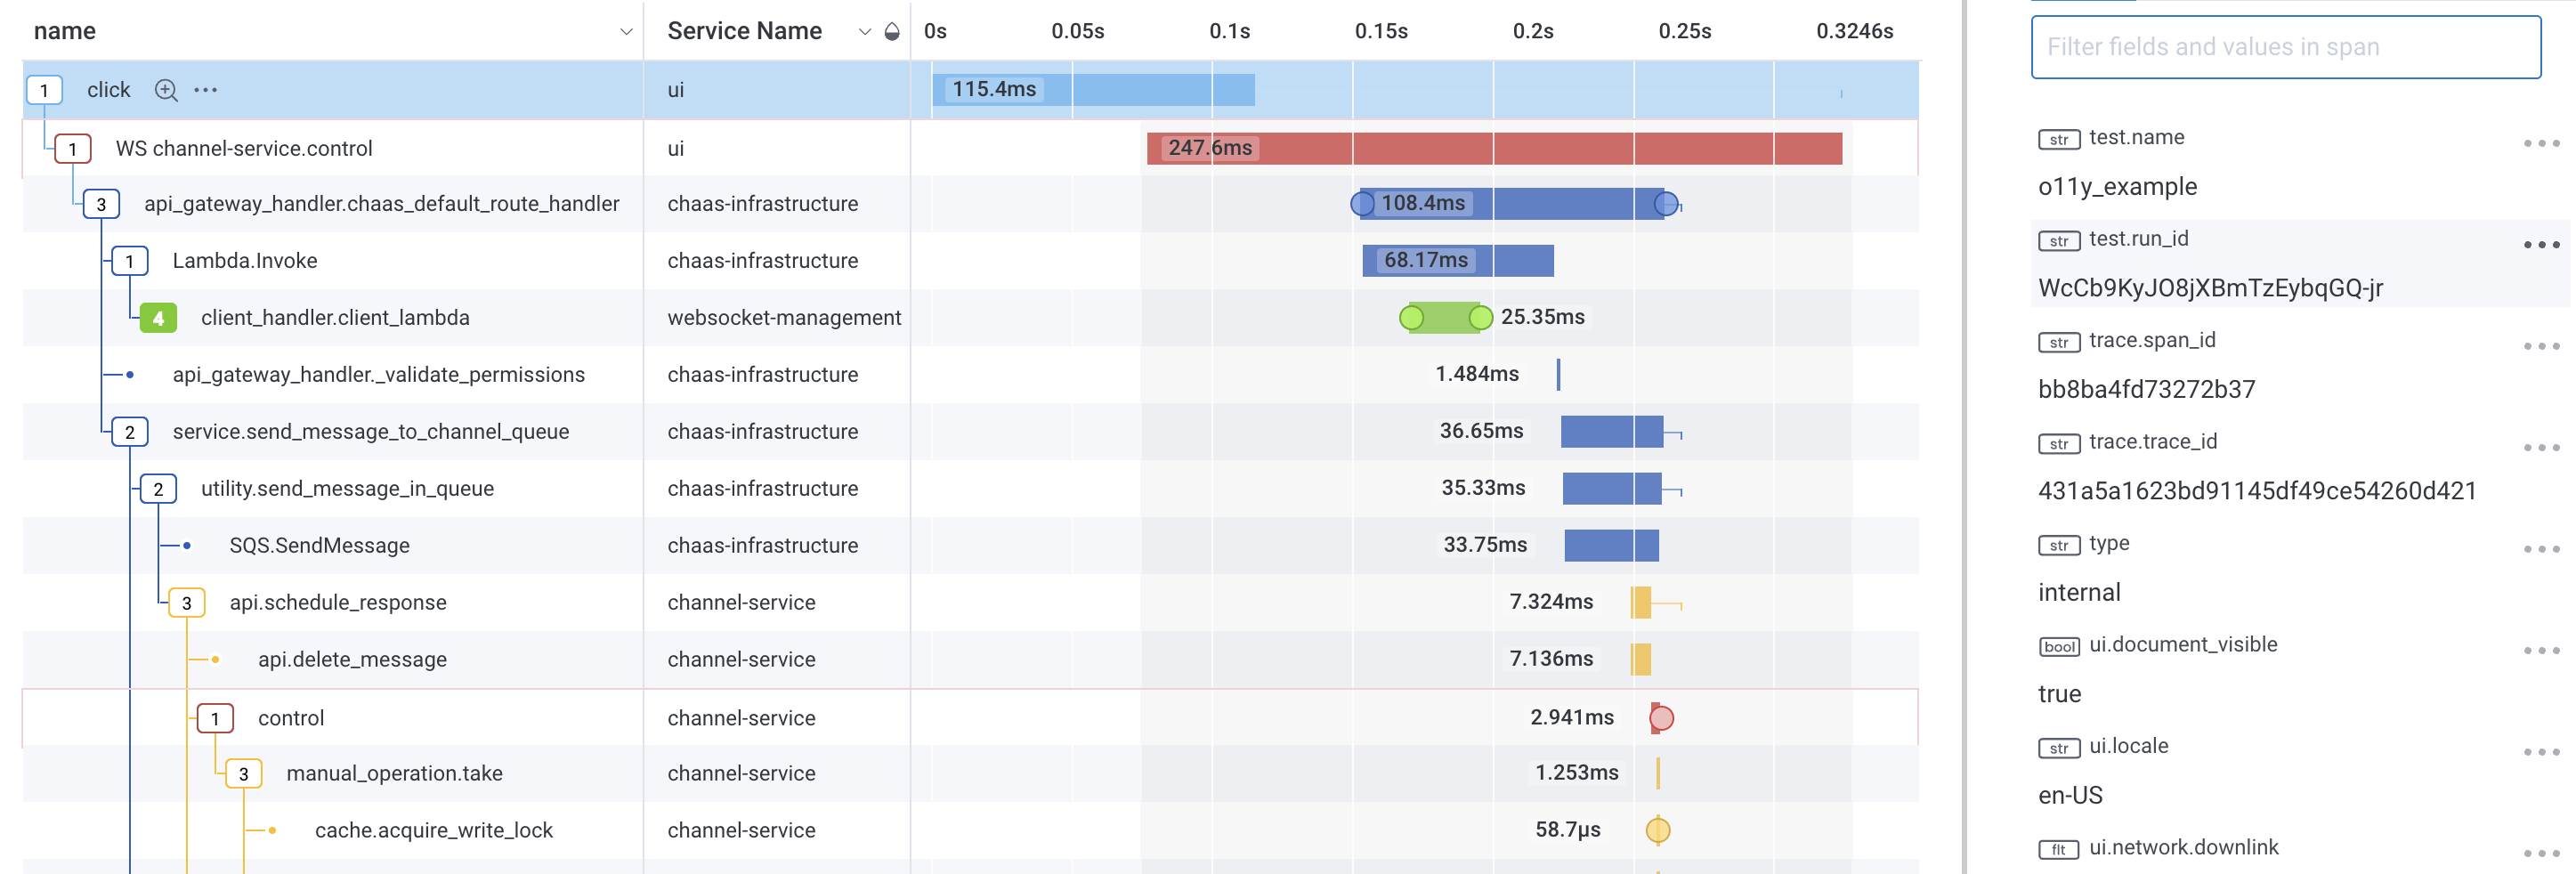
This connection from the test into the system telemetry is very powerful, saving a load of debug time - we now know exactly what went wrong here.
Distributed Tracing
It’s not always possible to augment the system under test to inject fields for correlation, like we did with the browser app. As an alternative, and arguably superior solution for API testing, we can use Distributed Tracing. We’ve already seen the parent-child relationships in traces when the control flow passes from service to service. Just as test-steps belong to a test, spans for those steps can belong to a parent span. In our test-run we can introduce a new parent so all calls in the run are grouped into a single trace, beautiful!
Enter testevents
I created and open-sourced testevents to provide a way for a mabl test to easily “open” and “close” spans using simple API calls. mabl’s Browser and API Tests both support an easy way to call an API, parse the output into variables and inject these variables wherever needed in the rest of the test. (testevents was inspired by Honeycomb’s buildevents project which solves a similar problem to instrument CI builds.)
API Test Example
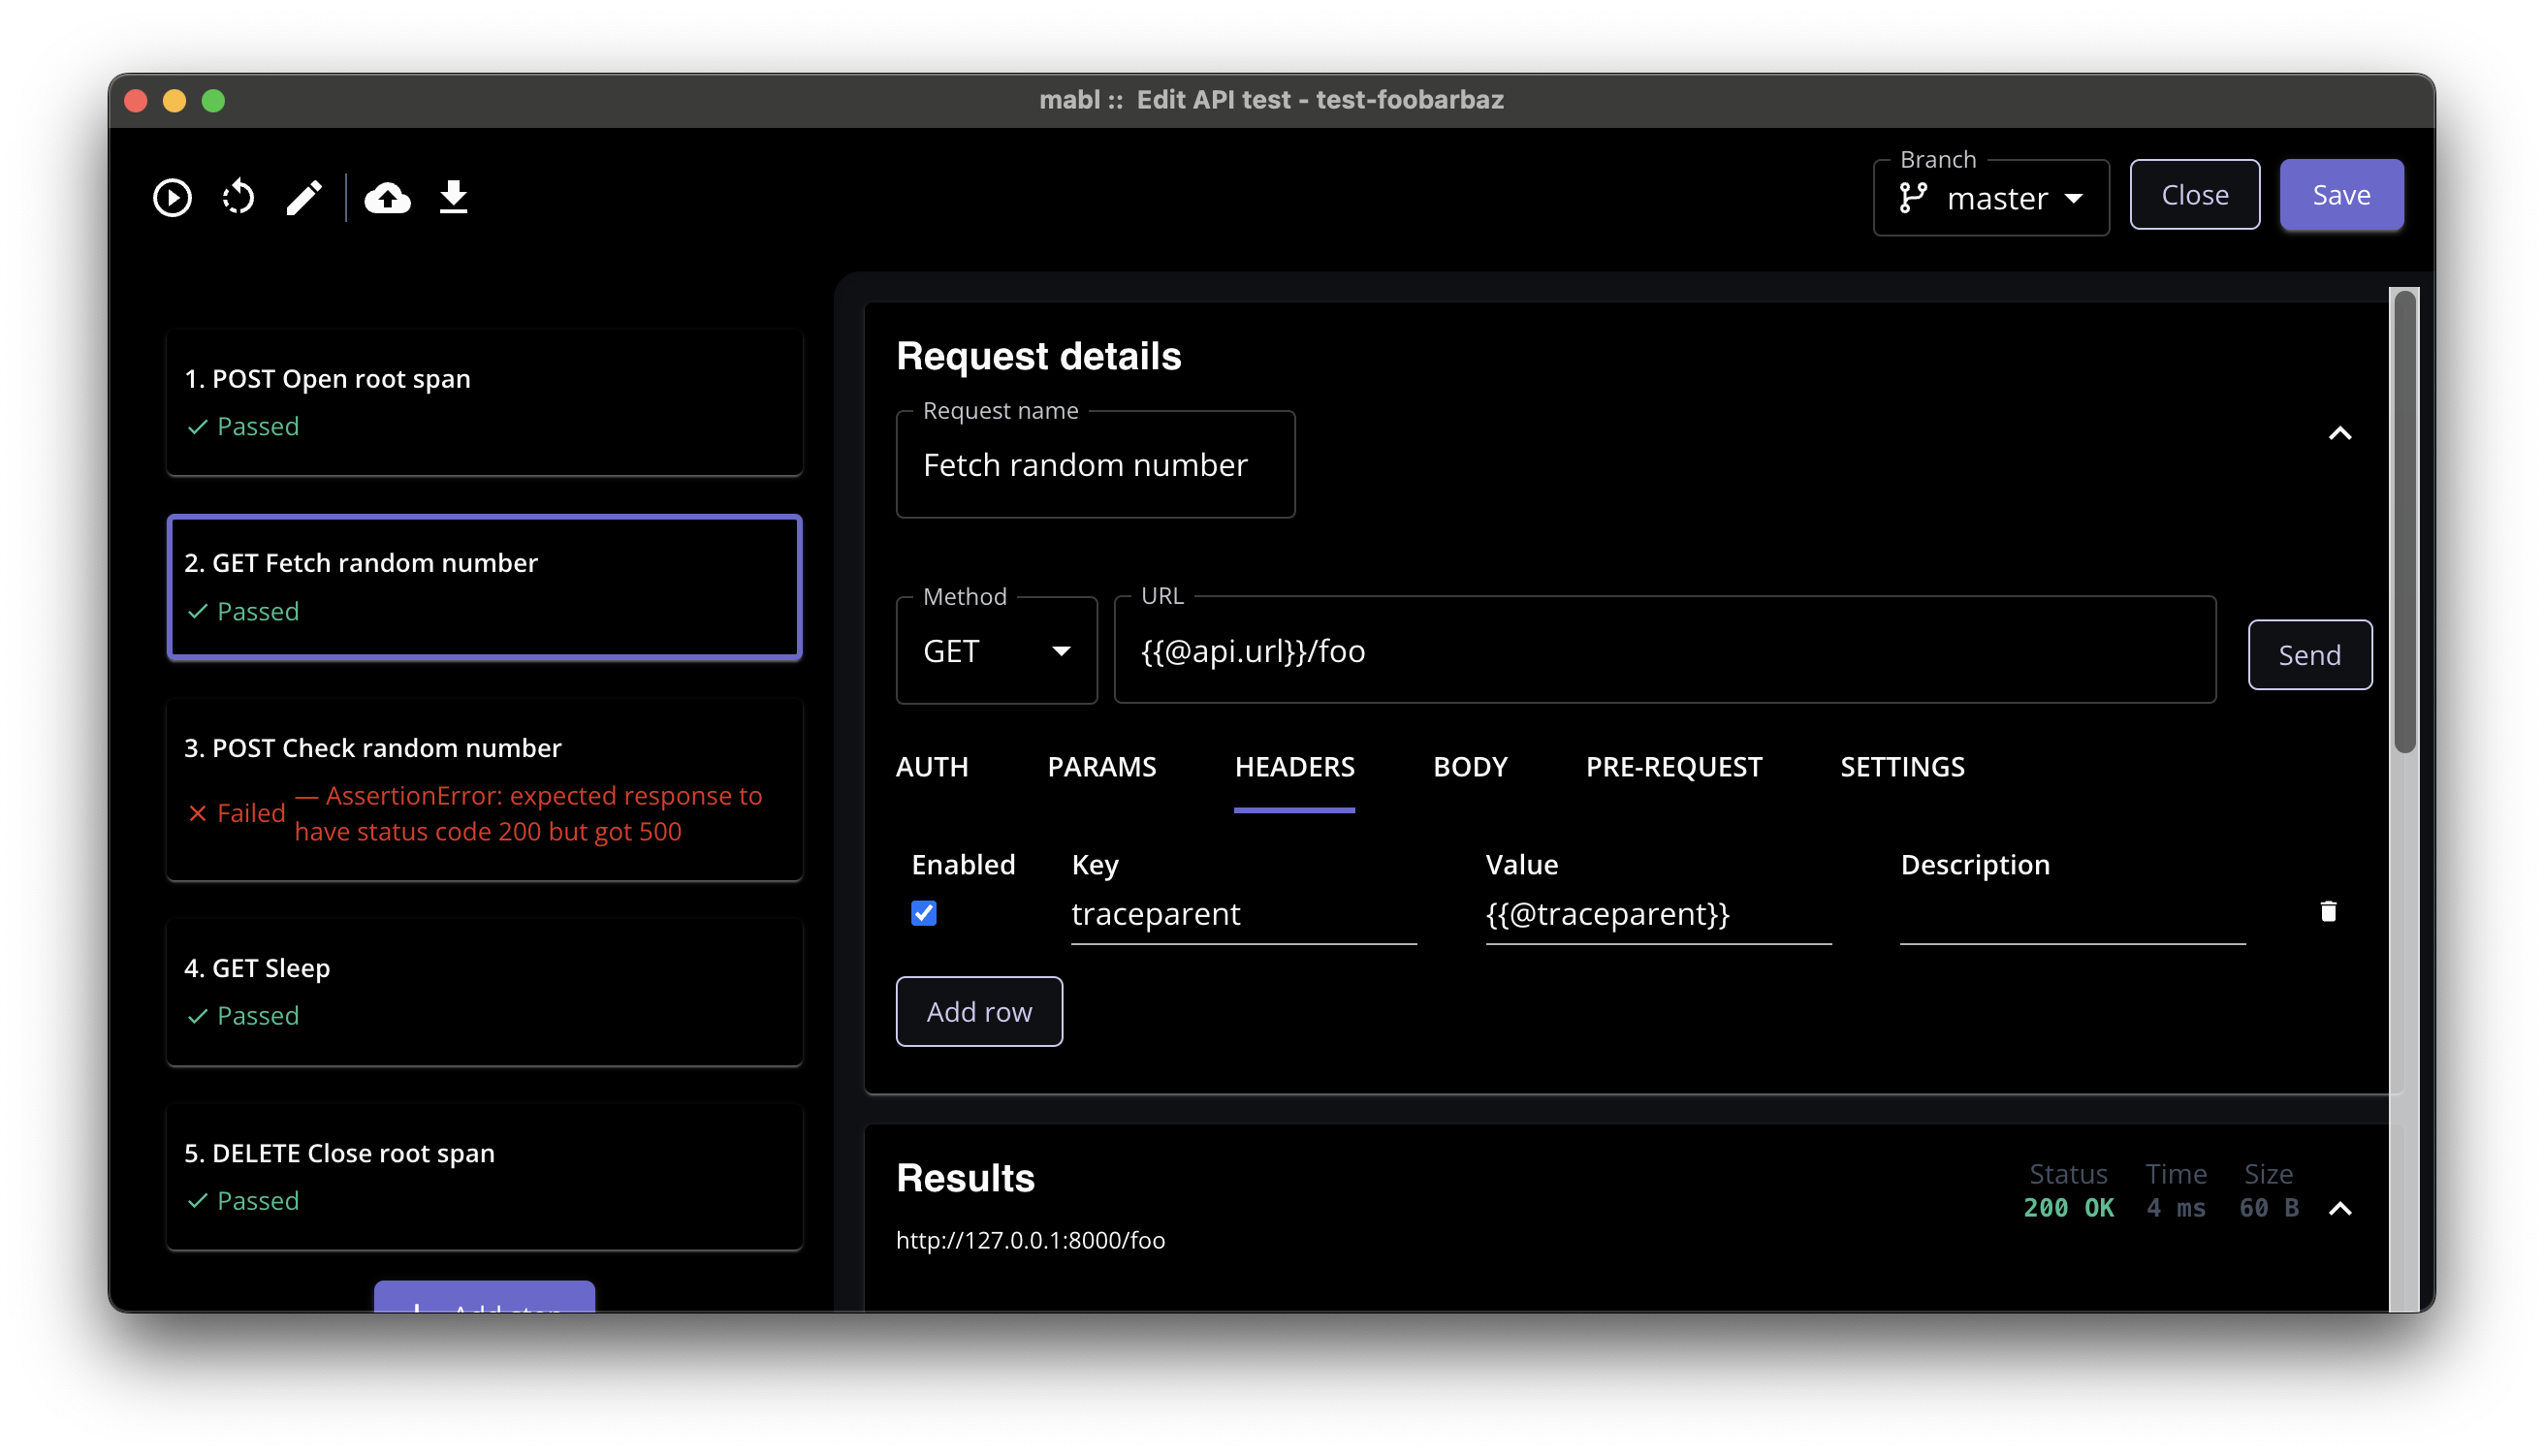
To illustrate the power of combining Honeycomb and mabl I created a simple instrumented fastapi app. Here is an API test in mabl that has failed on a step:
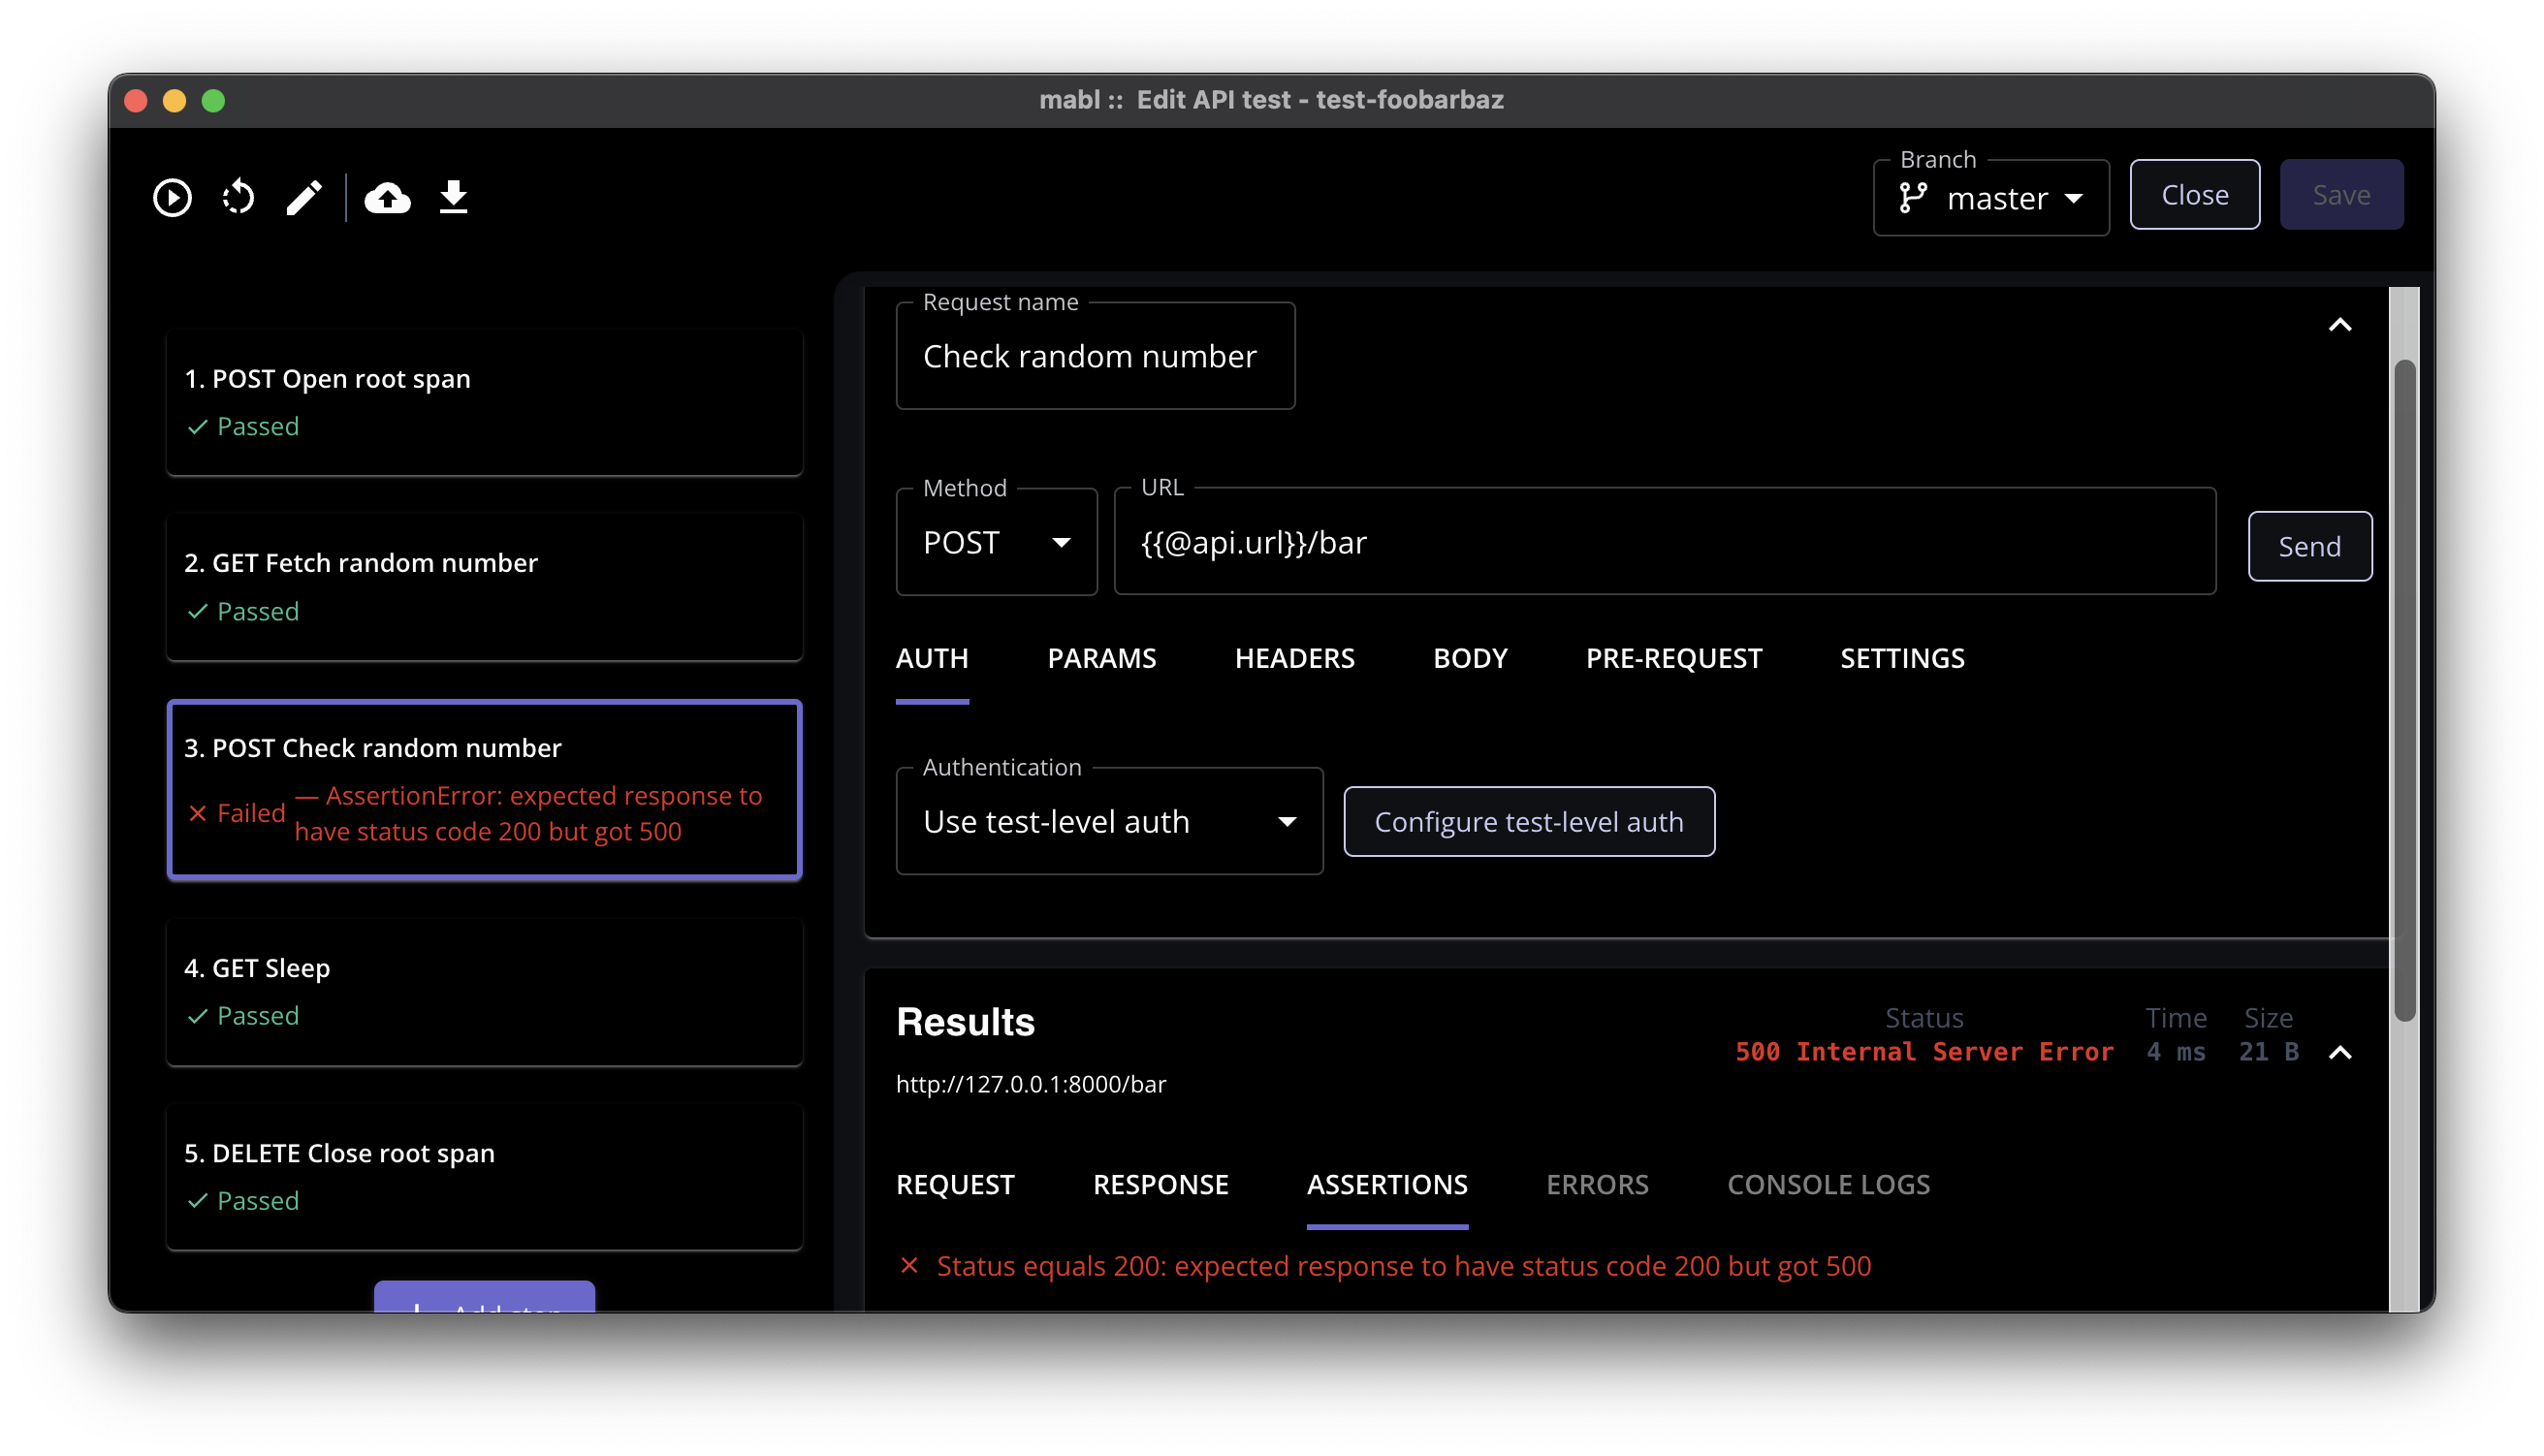 mabl tells us that we failed an assertion at step 3 - “Check random number”, we were expecting 200 and received 500. That’s great! But how do I debug from here? Go look in logs and search for an error message? No, we have Honeycomb, so search in there: write a query to find the API call that failed. What if there was more than one failure for that API? How do I find this one? … We would get there eventually but if we had this in a distributed trace we could go straight to this test-run:
 Et voilà!
Open the root span
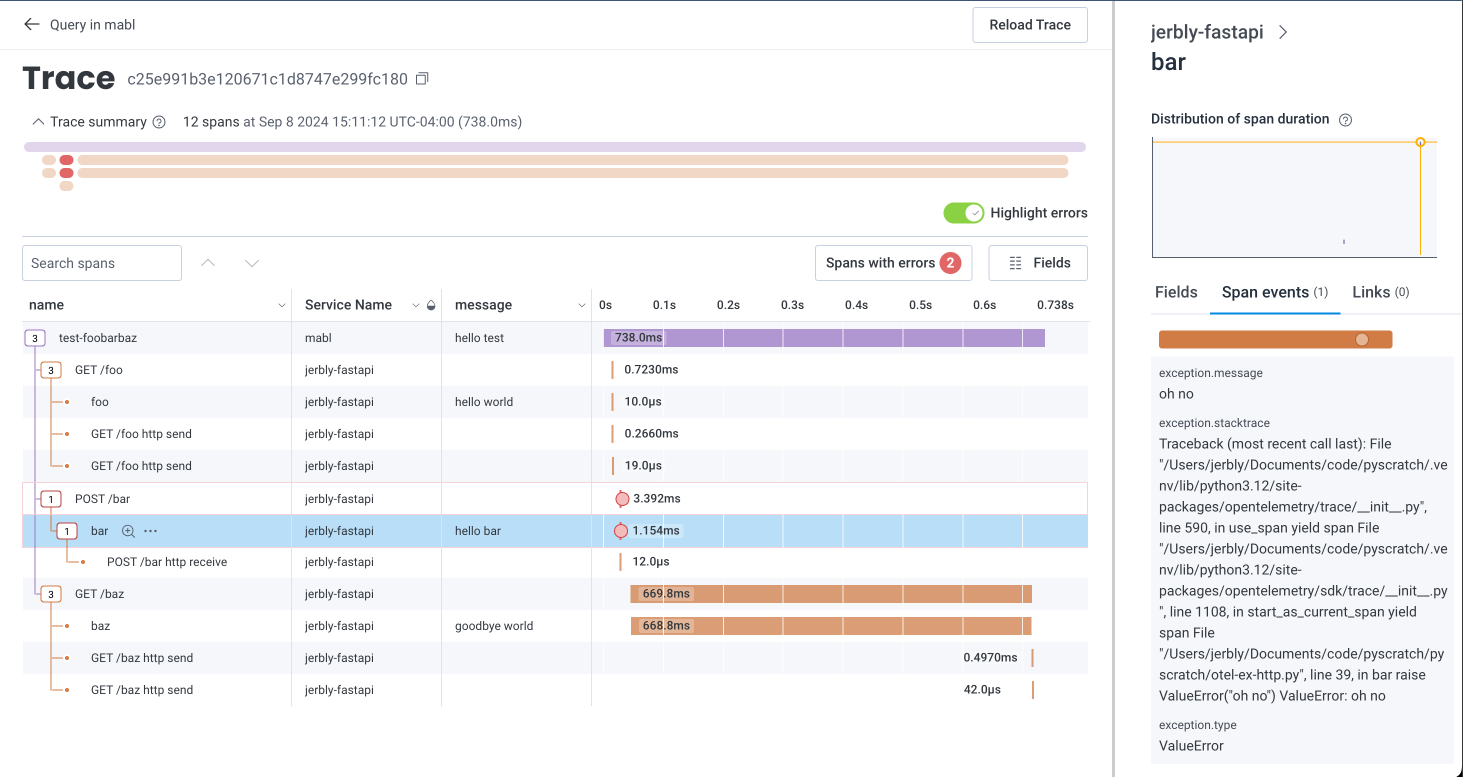
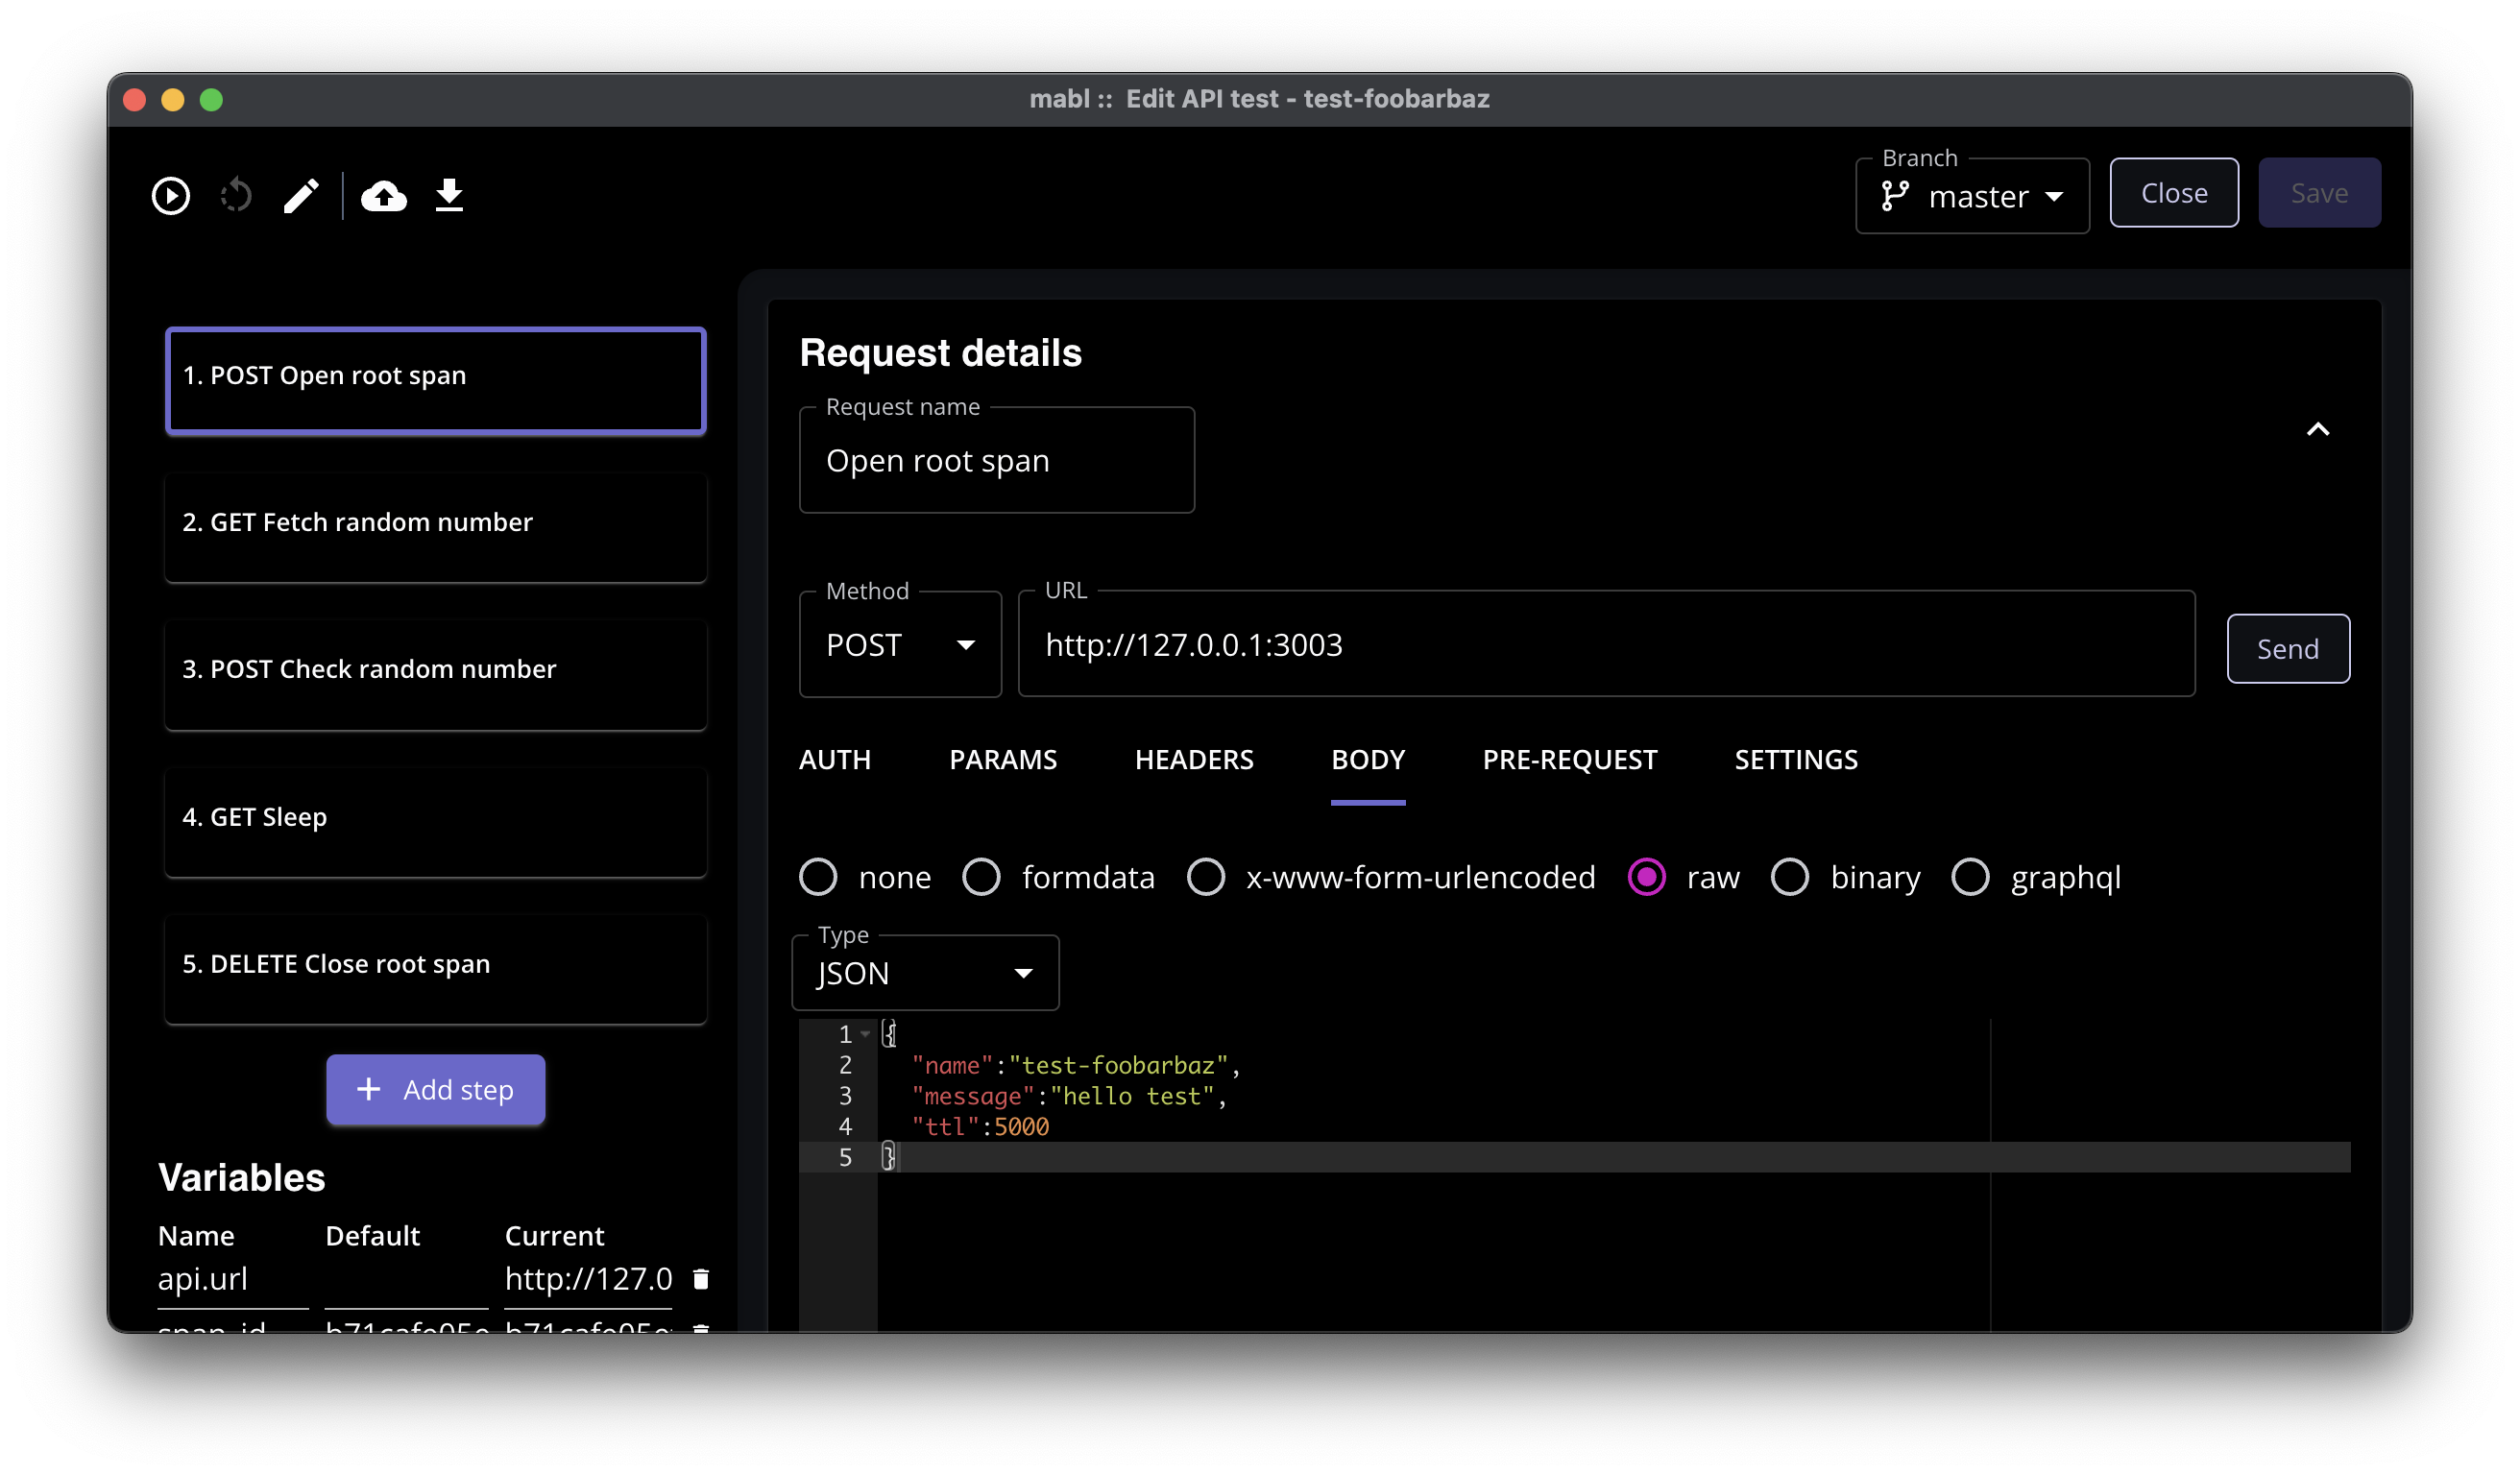
Take a look at the trace above. The first row has service name mabl with a span named test-foobarbaz this matches our test and is simple to query for: where name = test-foobarbaz in the mabl dataset. service.name comes from the OTEL_SERVICE_NAME env var setting for testevents. The only mandatory field name, comes from the first step in the test-run, a POST to where testevents is hosted (in this case localhost:3003):
{
  "name":"test-foobarbaz",
  "message":"hello test",
  "ttl":5000
}
ttl we’ll discuss later, any other name-value pair supplied here will be delivered as a span-attribute.
trace_id, span_id and traceparent
{
  "span_id": "e0b37648cf33bb68",
  "trace_id": "6093021aefb96a0ebfd67505b6da4667",
  "traceparent": "00-6093021aefb96a0ebfd67505b6da4667-e0b37648cf33bb68-01"
}
These three returned fields need to be parsed out into variables:
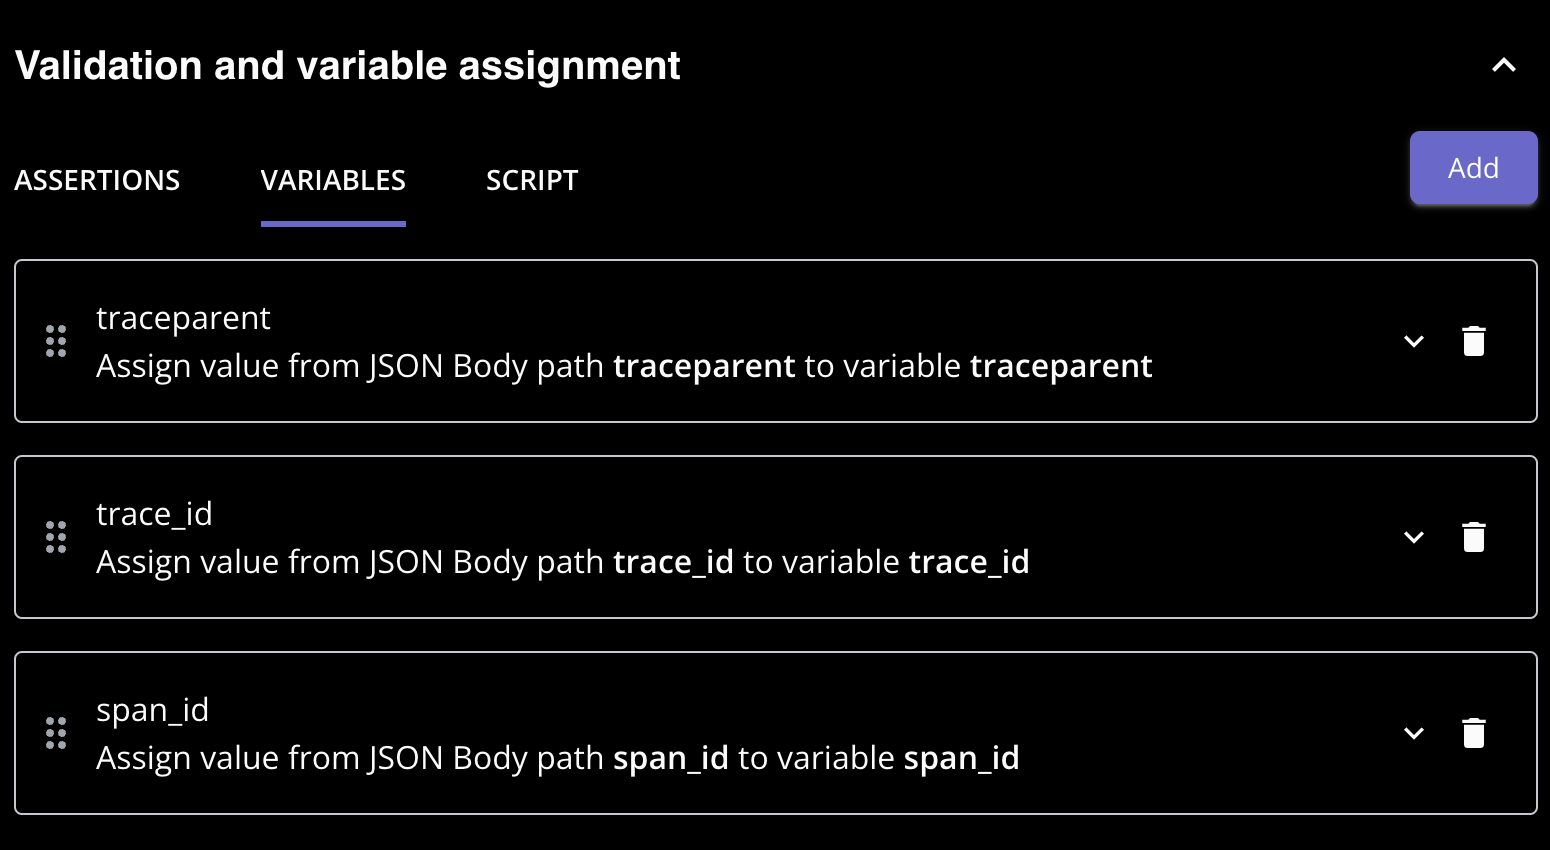
trace_id and span_id are needed to update, delete or add a child to the span.
traceparent header
To have the calls to /foo, /bar and /baz belong to the parent we have to pass the traceparent to link them together. For HTTP calls the traceparent is passed in a header.
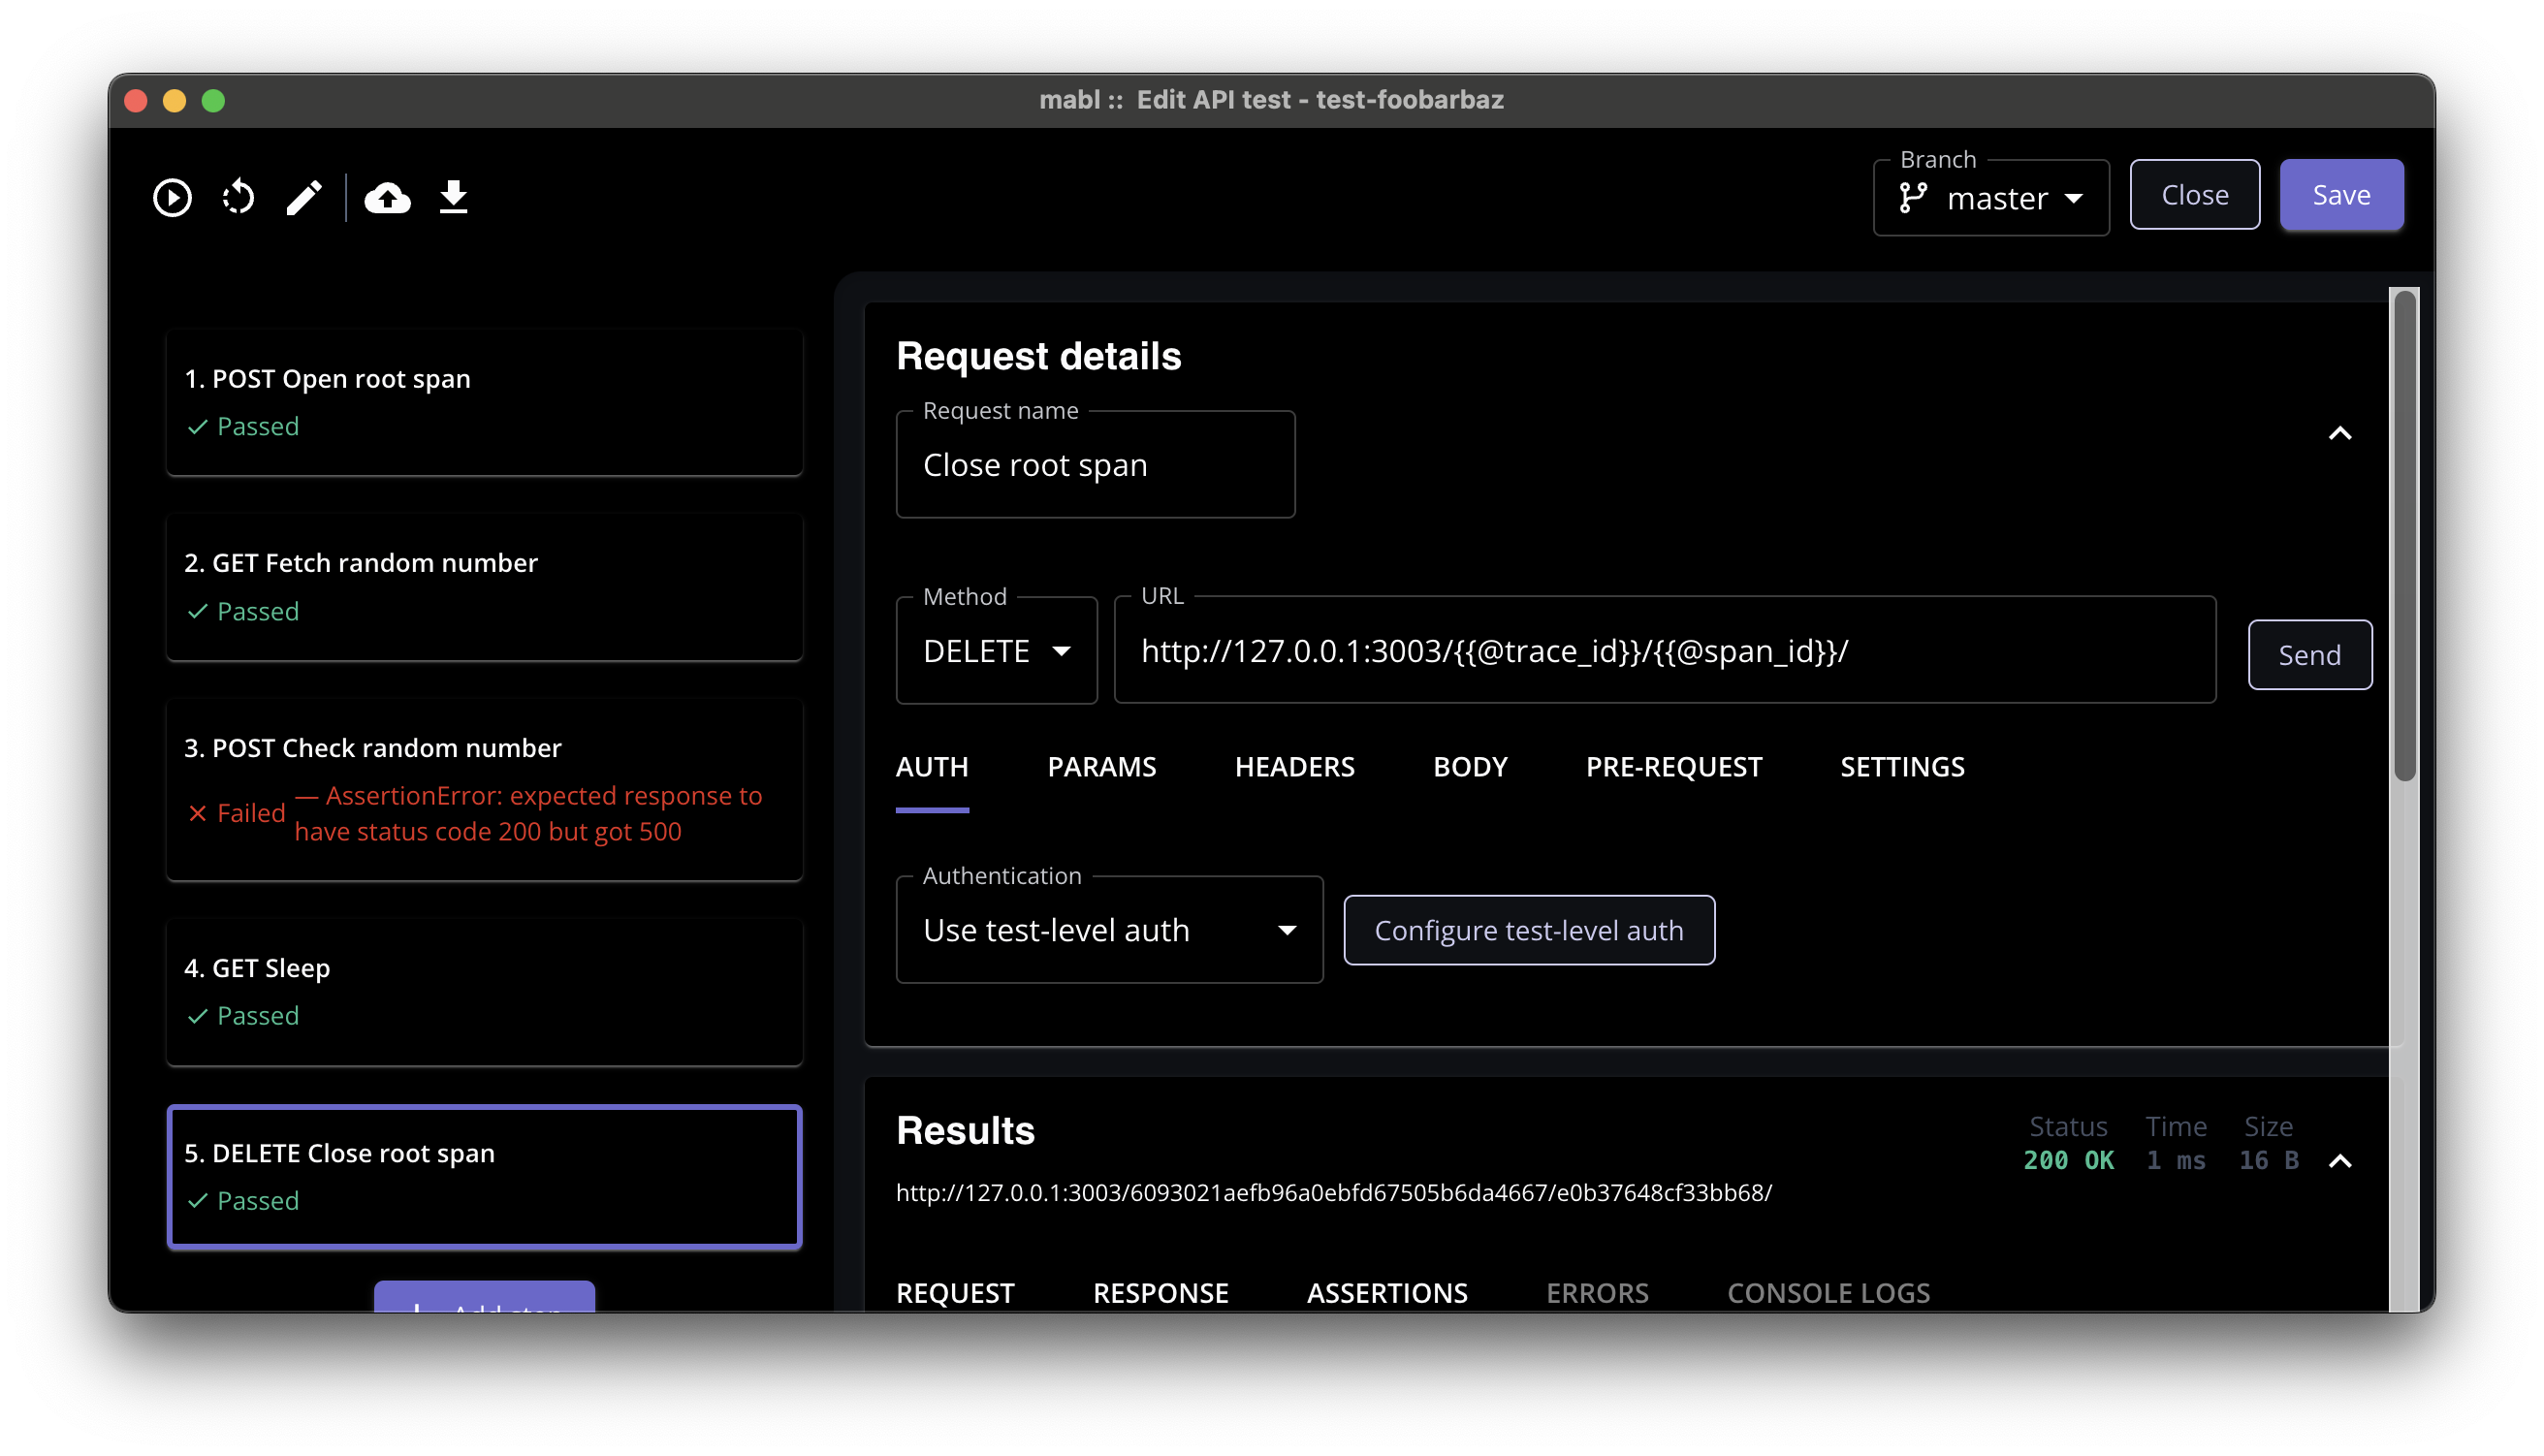
Close the root span
At the end we send a DELETE with the trace_id and span_id to close the span.
http://127.0.0.1:3003/{{@trace_id}}/{{@span_id}}/
testevents will send the root span to Honeycomb at this point.
Let’s debug!
Now that we have a nice trace for the test-run, let’s zoom in on the error in Honeycomb.
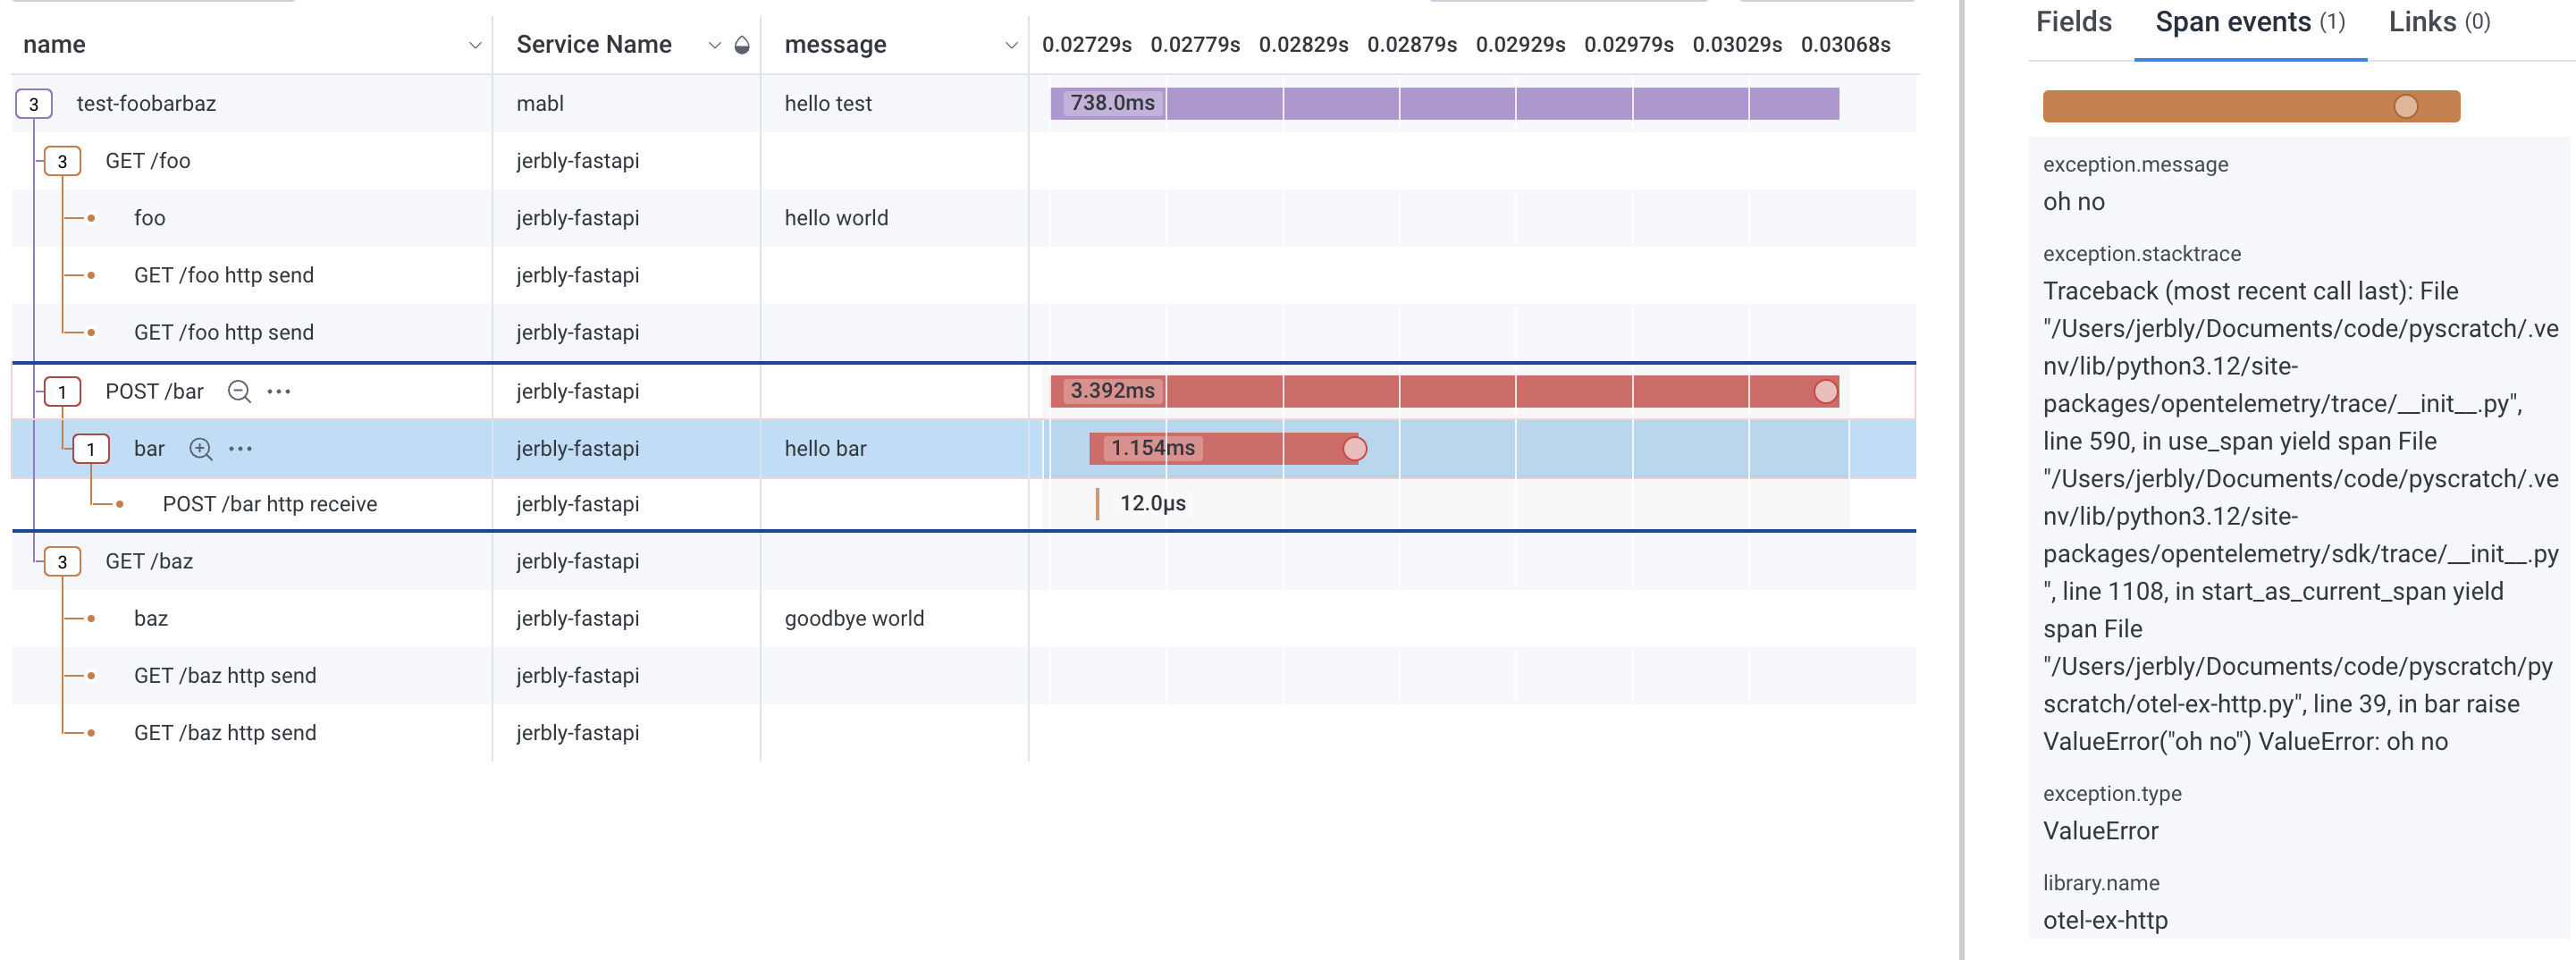
Honeycomb is showing an exception raised in the bar span with exception.message = oh no, exception.type = ValueError and a nice exception.stacktrace. Here’s the code for bar:
@app.post("/bar")
async def bar(request: fastapi.Request):
    MESSAGE = "hello bar"
    with tracer.start_as_current_span("bar") as span:
        # Extract the random number from the request json
        data = await request.json()
        num = data["random_number"]
        span.set_attribute("random_number", num)
        span.set_attribute("message", MESSAGE)
        if num < 0.5:
            return {"message": MESSAGE}
        else:
            # Simulate an error
            raise ValueError("oh no")
Since we now know that values >= 0.5 will cause an error we may want to look for where that value came from. The test fetches random_number from the call to /foo - the joy of the trace is we can see that call just above! Without collecting these together under the same parent we would have to search again.
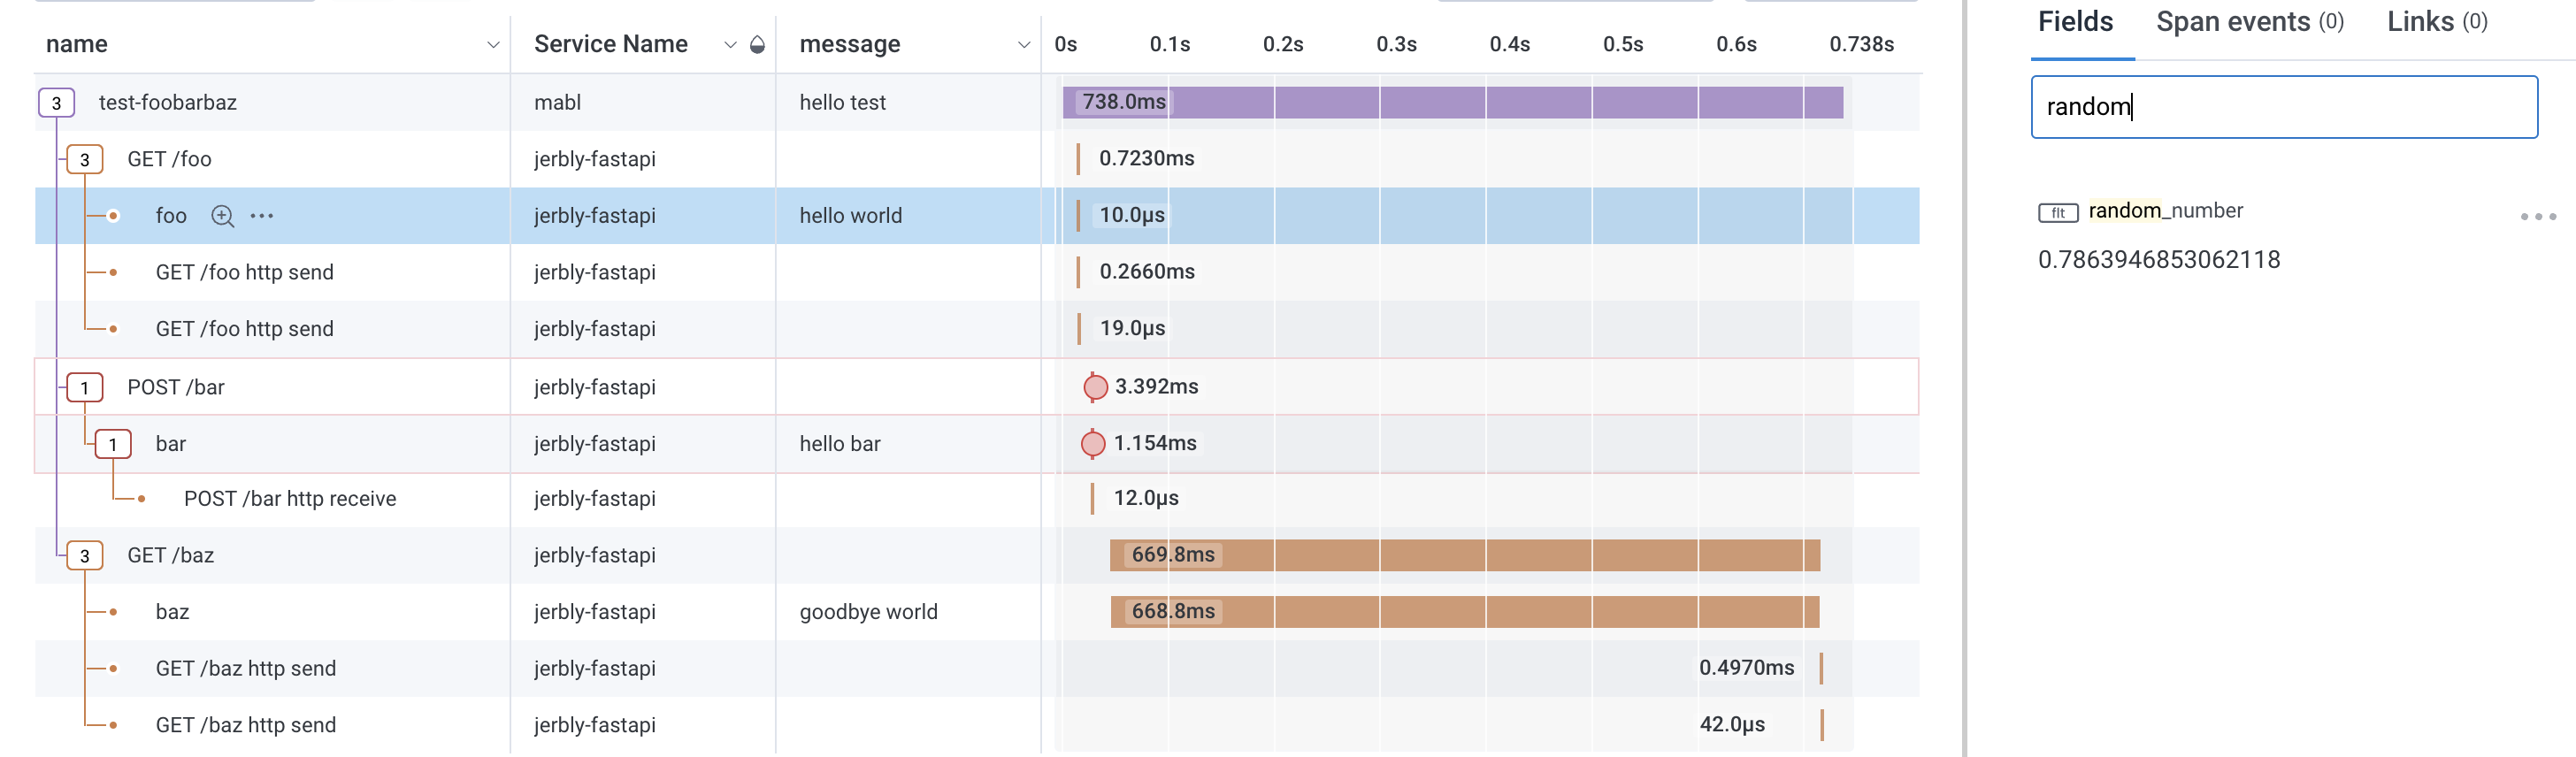
Click on the foo span and there we see random_number = 0.7863946853062118 - certainly greater than 0.5.
Finally /baz, this call is included to show how tracing helps to investigate performance issues. mabl Browser, API and Performance Tests all provide information about the round-trip time for execution steps. This may point you to dive into the call to /baz. With the additional tracing we can dig deeper with Honeycomb and see which span is running for a long time. For GET /baz the majority of the time, 668ms, is spent in the baz span. Less than a millisecond is spent returning the result.
API calls in Browser tests
You can wrap a Browser test with “open” and “close” span calls in the same way as an API test. testevents supports child spans too, with this you can start a new child span for each flow to further refine the context.
Unlike API tests, Browser tests will stop at the first assertion failure. This means the “close” span steps may not run. This is what ttl is for that I mentioned earlier. By providing a time-to-live when you open the span, testevents will close it for you with a timeout error when the ttl is reached. ttl and all other attributes can be updated with a PATCH.
Summary
mabl will point you to a failing or poorly performing test step. To help bridge the gap from test-run to source code, we use OpenTelemetry tracing with injected correlation fields and distributed traces.
Test outcomes like:
“This test step browser assertion failed”
become insights like:
“In the previous test step, a button click sent a webservice call that hit a bug in the microservice …”
and
“This test step failed and returned 500”
becomes
“This test step threw an exception parsing the input data …”
and
“This test step took 1200ms”
becomes
“This test step spent 1143ms in a database query with SQL …”