How many errors are acceptable?
Ask yourself this question about the service / app / module that you own. You’ve probably got something in mind close to zero. So are you monitoring errors? This seems like the most obvious thing, right?
This post is about observability for errors using Honeycomb via OpenTelemetry. You can really easily get setup with an SLO for error rates in Honeycomb but there are some pitfalls and interesting tidbits to understand that will deepen your knowledge.
When is an error not an error?
…and whose error is it?
To be clear, by error I mean an Exception/Error raised by your code due to fault. Too often, exceptions are used for the normal operation of your code. Unfortunately, automatic tracing can report these as errors through your telemetry or into your log file. This creates noise, “Oh, yeah, that… that error’s not a real error.”
Some examples of things you shouldn’t be reporting as an error:
- Exceptions used for control flow: Try X, if I get an exception try Y. Try to delete X even if it doesn’t exist. Keep reading until I get an exception. Sadly, some libraries work this way. If you’re forced, don’t report it as an error - it’s not!
- Negative result: If a caller asks your service to return something about X and X doesn’t exist, that’s not an error in your service. It could be an error in the caller’s service.
- Something Expected: Similarly, if your service expects a condition to occur and handles it, it’s not an error. Perhaps it’s a warning of sub optimal behaviour.
OpenTelemetry
Errors are represented in the Span Status and optionally with an Exception Span Event:
- Every Span has a status, with code: 0=UNSET, 1=OK, 2=ERROR
- Good spans are 0 or 1. (1 is very rarely used)
- Bad spans, 2, also include a status message (sometimes referred to as description)
- Use Set Status to report an error:
span.set_status(ERROR, “A bad thing happened”)
- Semantic Conventions define a common global standard for attributes.
- The exception semantic convention defines attributes:
message,type,escapedandstacktrace - Use Record Exception to add detail about the error in a span-event:
span.record_exception(exception)
How errors show up in Honeycomb
- Every span has:
status_codeset to 0,1 or 2 - If it’s an error span it will have:
status_messagewith your messageerrorset totrueerrorset totrueon every child span-event and span-link!
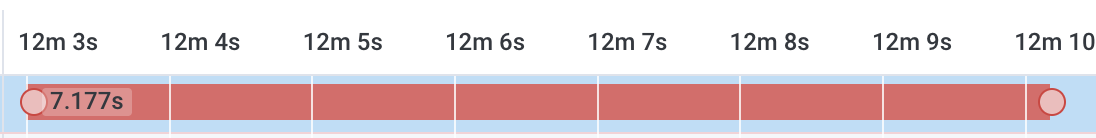
This span contains two span-events, the final one is an exception event. The first span-event is not at fault and yet is marked with the error flag. So there are 3 events in total with error = true here:
- If you called
record_exception:- You’ll get a span-event containing the attributes from the semantic convention.
- Honeycomb also copies these attributes from the first exception event, back into the span itself
Here’s the code in the Husky project for this behaviour. Understanding how the error flag and exception messages are duplicated is important to make more accurate SLOs.
How to create an SLO for error rate
Simple error rate SLO:
“99.9% of spans over 24 hours should be good”
Make an SLI (Service Level Indicator) to denote good spans. An SLI is a derived column.
    IF(
        EXISTS($status_code),
        NOT(EQUALS($status_code, 2))
    )
Remember: Honeycomb queries work at the Honeycomb “event” level. In the tracing signal domain an “event” is a span, span-event or span-link. Given the duplication of error discussed above it is unwise to use this flag in SLIs since non-errant span-events or span-links will skew the count. status_code is used here because of this and the EXISTS($status_code) excludes span-events and span-links.
This SLI is so generic that I recommend adding at the environment level.
Select the environment from the left hand menu and click
Manage Environments: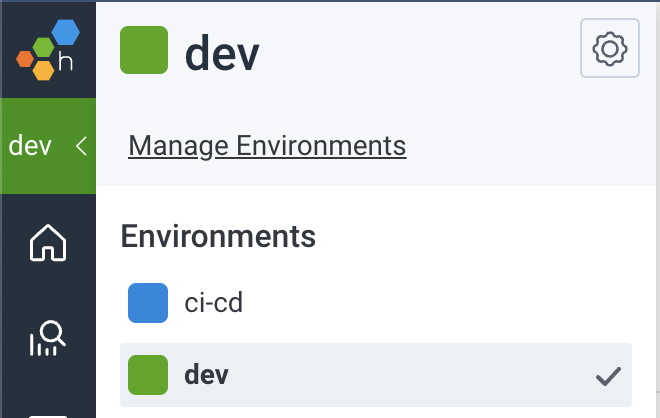
Select your environment and then Schema, enter the Derived Column here:
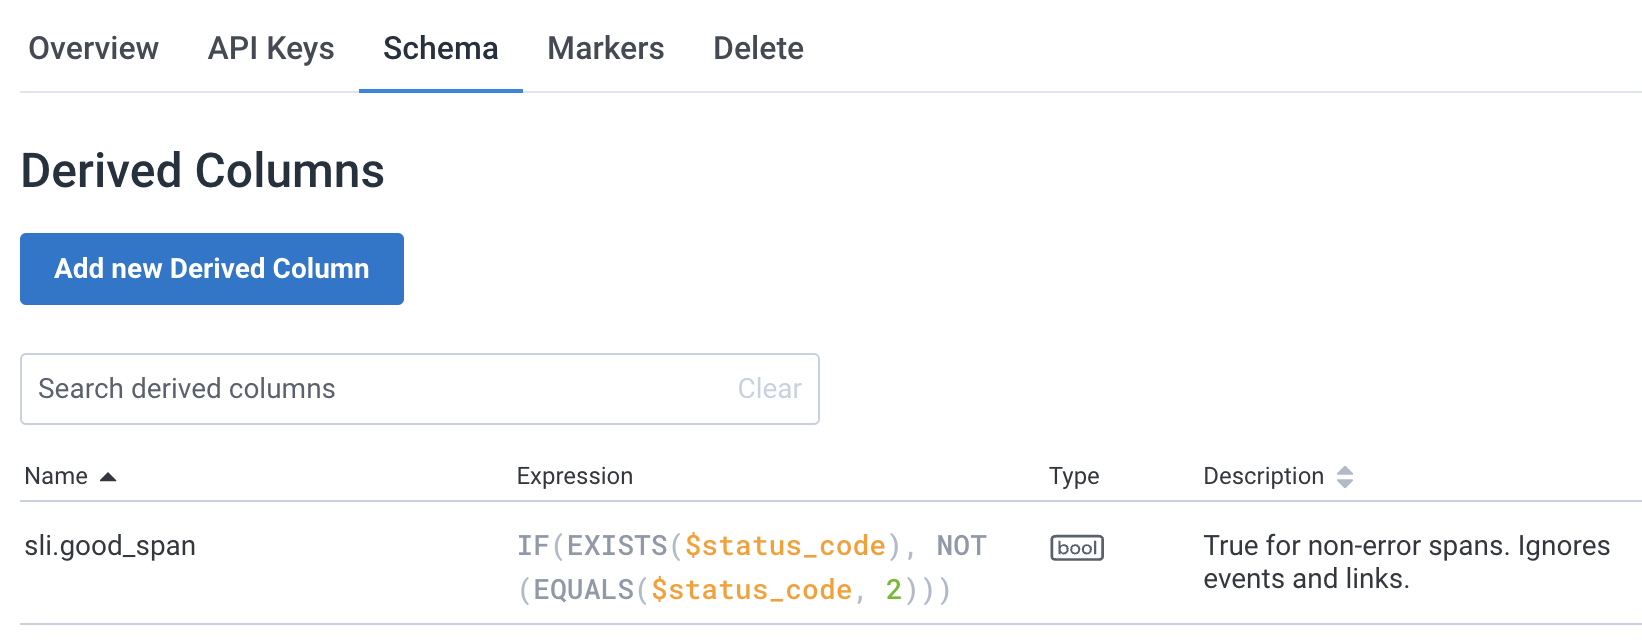
sli.good_spanis now available to every dataset in this environment. When you create your SLO the SLI dropdown will have this ready to select: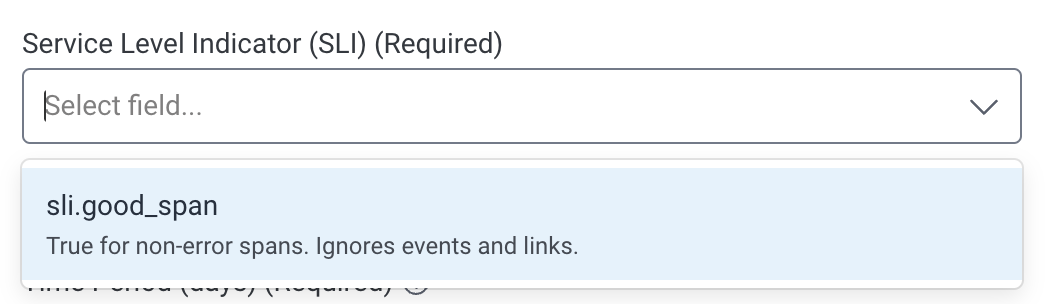
If you’re unfamiliar with SLOs the documentation can help you from here.
Summary
Errors reported from your software are a foundational signal for service health, therefore don’t pollute this with non-errors crying wolf. Avoid the error flag in queries and SLIs since it’s duplicated across events. Create a simple environment-wide SLI for every service team to easily get started with the most fundamental SLO.